Key Takeaways
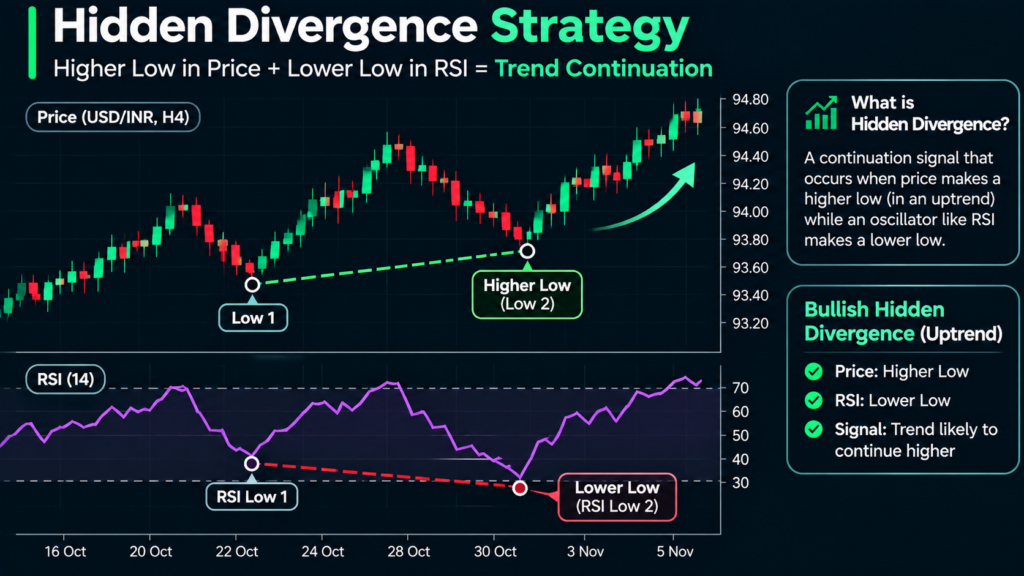
- Hidden bullish divergence: price makes a higher low while RSI or MACD makes a lower low, inside an uptrend.
- Hidden bearish divergence: price makes a lower high while the oscillator makes a higher high, inside a downtrend.
- Regular divergence hints at reversal; hidden divergence hints that the existing trend may continue.
- It only works when a clear trend exists, and it needs confirmed swing points and a trigger candle.
- Size every trade in rupees: on NSE EUR/INR futures, each paise of movement is worth ₹10 per lot.
Most traders learn divergence as a reversal signal and then lose money fading strong trends. Hidden divergence flips that idea and uses the same oscillator to join a trend after a pullback. This guide explains a hidden divergence strategy step by step for Indian traders who use RSI or MACD on currency futures, gold or forex charts. You will learn how hidden divergence differs from regular divergence, what rules filter out weak signals, and how to size a trade on NSE’s EUR/INR futures with a clearly defined rupee stop. The example uses hypothetical numbers so you can follow the arithmetic.
What is a hidden divergence strategy?
A hidden divergence strategy is a trend-continuation method. In an uptrend, you look for a pullback where price makes a higher low but the oscillator, such as RSI, makes a lower low. That mismatch suggests the pullback was shallow relative to momentum, and you buy in the trend’s direction with a stop below the swing low.
Divergence is when price and an oscillator disagree about the direction of recent swings. LuxAlgo’s concept library describes the core idea of hidden divergence as “the oscillator, not price, makes the more extreme print.” In regular divergence, price makes the extreme and the oscillator fails to confirm it.
Put simply: in hidden bullish divergence, momentum dipped harder than price did. Buyers defended a higher level even though the oscillator looked weak, which is often what a healthy trend pullback looks like.
Regular vs hidden divergence: what is the difference?
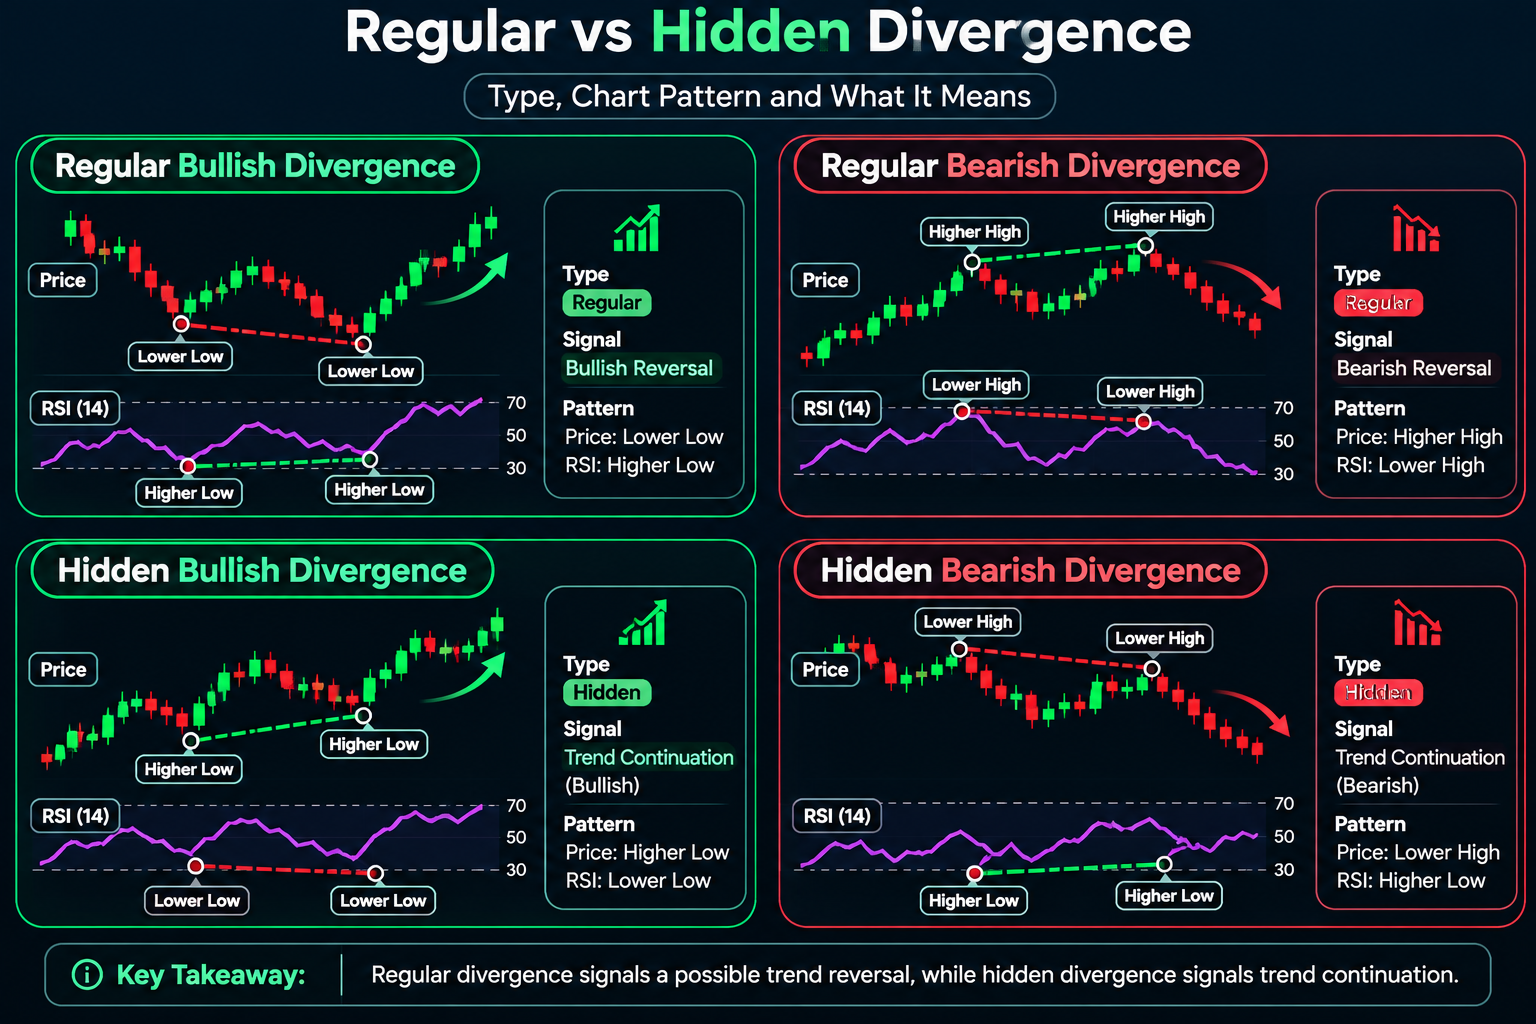
The two types use the same tools but answer different questions. Regular divergence asks, “Is this trend running out of steam?” Hidden divergence asks, “Is this pullback over?”
| Type | Price swing | Oscillator swing | Trend context | Typical reading |
|---|---|---|---|---|
| Regular bullish | Lower low | Higher low | Downtrend | Possible reversal up |
| Regular bearish | Higher high | Lower high | Uptrend | Possible reversal down |
| Hidden bullish | Higher low | Lower low | Uptrend | Possible continuation up |
| Hidden bearish | Lower high | Higher high | Downtrend | Possible continuation down |
A simple memory aid: regular divergence compares highs in an uptrend and lows in a downtrend, the trend’s extremes. Hidden divergence compares the pullback points: lows in an uptrend, highs in a downtrend.
LuxAlgo flags a frequent misuse: confusing the two and taking a countertrend trade at a poor location. If you see a lower low on RSI in an uptrend and treat it as “bearish”, you have read a hidden bullish signal backwards.
How do you spot RSI hidden divergence?
The Relative Strength Index (RSI) is a momentum oscillator that moves between 0 and 100 and compares the size of recent gains with recent losses. Our RSI indicator guide covers the calculation and default settings.
For RSI hidden divergence, the usual process is:
- Confirm an uptrend first: higher highs and higher lows on your trading timeframe, or price above a rising moving average.
- Mark the last confirmed swing low on price and the RSI value at that bar.
- Wait for a new pullback that forms a higher swing low on price.
- Check whether RSI at the new low prints below its previous low. If it does, you have hidden bullish divergence.
In strong uptrends, RSI pullbacks often stop in the 40 to 50 zone rather than falling below 30. That is normal. Hidden divergence does not need RSI to reach “oversold”.
MACD hidden divergence
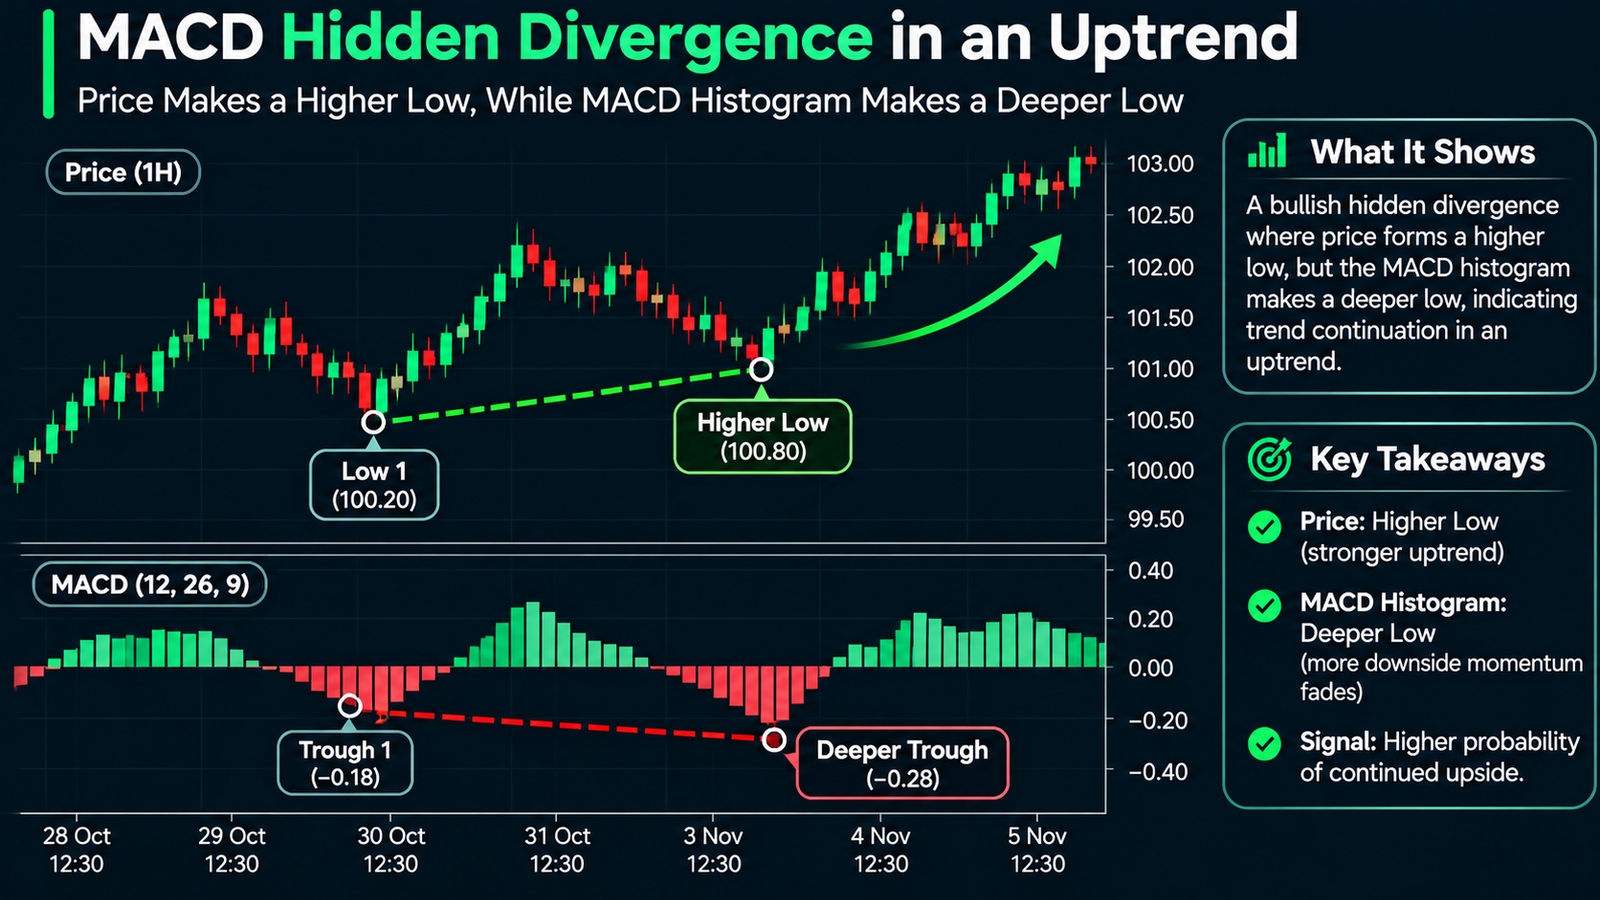
MACD (Moving Average Convergence Divergence) measures the gap between two exponential moving averages, usually 12 and 26 periods, with a 9-period signal line. You can compare either the MACD line or the histogram troughs. See MACD explained for the components.
MACD reacts more slowly than RSI, so its hidden divergences appear less often but over larger swings. Many traders use RSI to spot the setup and MACD as a second check.
Why hidden divergence needs a trend (and confirmed swings)
LuxAlgo states the limitation plainly: hidden divergence is only defined when there is a trend to continue. In a sideways market, “higher lows” and “lower lows” are just noise inside a range, and the signal loses its logic.
The second issue is confirmation lag. A swing low only counts once a few bars have closed on both sides without breaking it. Lines drawn to unconfirmed pivots can “repaint”, meaning the divergence that looked clear in real time disappears a few candles later. Many indicator scripts that auto-draw divergences show historical signals that were not visible at the time.
A practical filter many traders use is a higher-timeframe check. If you trade the 1-hour chart, confirm the trend on the 4-hour or daily chart. Our guide to multi-timeframe analysis shows how to line up the two.
Hidden divergence strategy rules: a step-by-step plan
- Define the trend on a higher timeframe. For a long, price should be above a rising 50-period moving average on the 4-hour chart, with a clear higher-high, higher-low sequence.
- Wait for a pullback on your trading timeframe. On the 1-hour chart, price should retrace toward support, the moving average or a prior breakout level.
- Confirm the higher swing low. Wait for at least two to three candles to close above the new low before treating it as a swing point.
- Check the oscillator. RSI (14) at the new swing low should be lower than at the previous swing low. Optional: MACD histogram shows a deeper trough too.
- Wait for a trigger. Use a bullish close above the high of the swing-low candle, or a break of a short-term down trendline.
- Place the stop below the swing low. Add a buffer based on volatility; our ATR stop-loss tool can size that buffer.
- Size the position in rupees. Decide your maximum loss first, then compute lots.
- Set a target or trail. Common choices are the prior swing high, a 2:1 reward-to-risk target, or a trailing stop under new higher lows.
Reverse every rule for hidden bearish divergence in a downtrend.
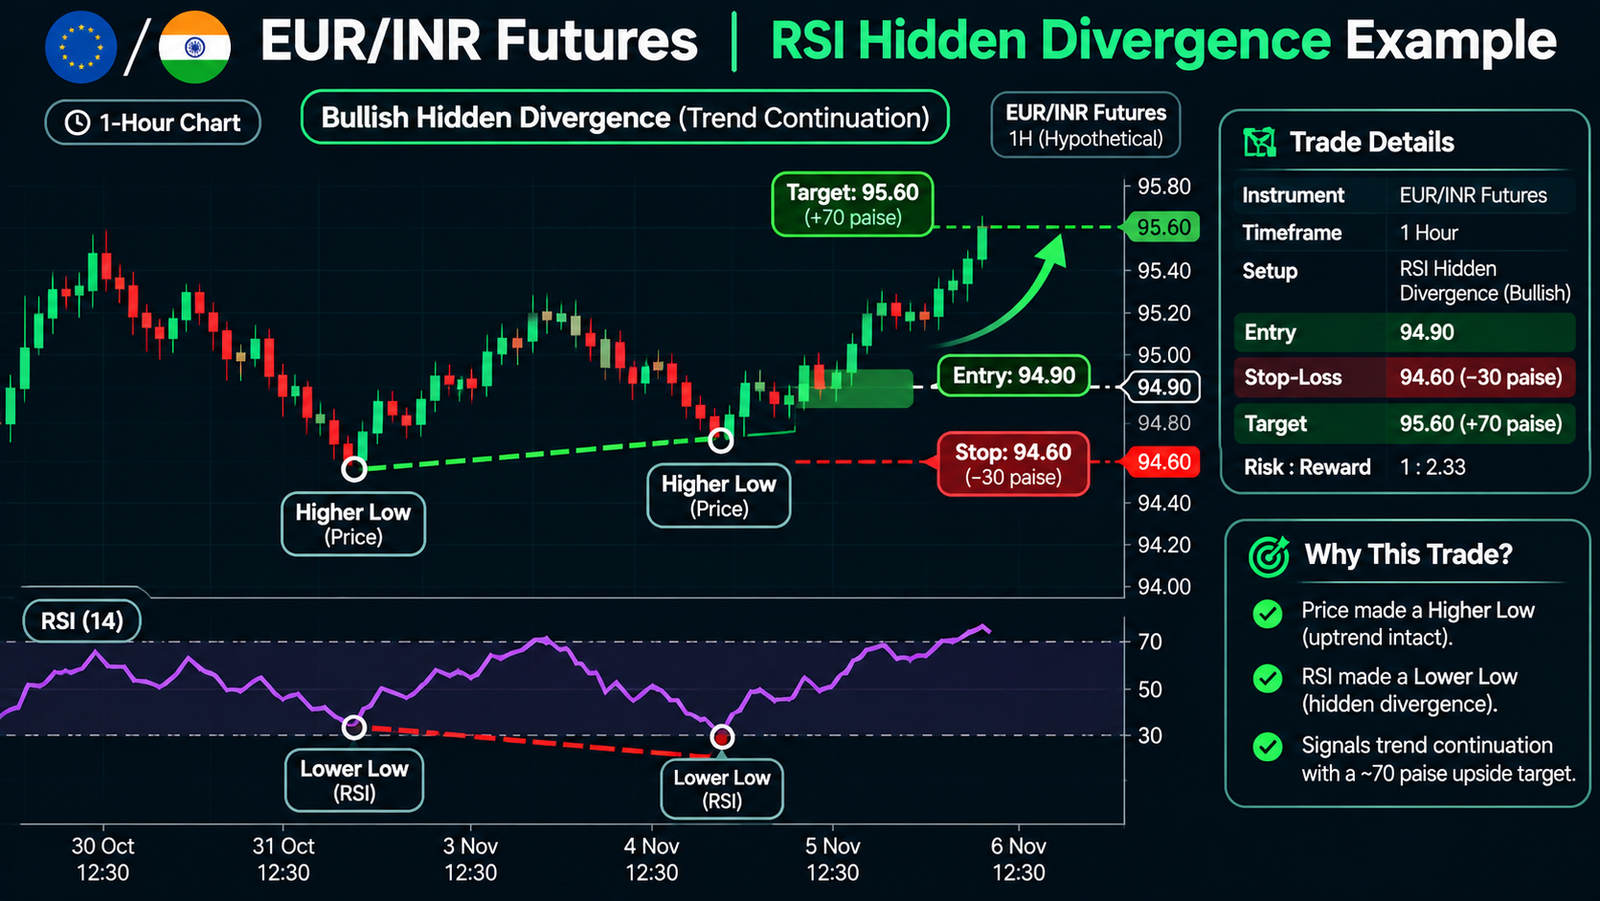
Example: hidden bullish divergence on EUR/INR futures
EUR/INR futures trade on NSE. According to NSE’s contract specifications for INR pairs, one EUR/INR lot is €1,000, and INR pair contracts have a tick size of 0.25 paise, with trading from 9:00 am to 5:00 pm IST. That makes one tick worth ₹2.50 per lot and one full paise worth ₹10 per lot.
Example (all prices hypothetical): A trader in Bengaluru has ₹1,00,000 of capital and risks 1% per trade, which is ₹1,000.
- Trend: On the 4-hour chart, EUR/INR near-month futures are in an uptrend above a rising 50-period average.
- Previous swing low: 107.90, with RSI (14) at 44.
- New pullback low: 108.20, a higher low, with RSI at 38, a lower low. This is hidden bullish divergence.
- Trigger: A 1-hour candle closes at 108.45, above the swing-low candle’s high.
- Stop: 108.05, below the swing low with a small buffer. Distance = 40 paise.
- Risk per lot: 40 paise × ₹10 = ₹400.
- Lots: ₹1,000 ÷ ₹400 = 2.5, rounded down to 2 lots. Actual risk = ₹800, plus charges.
- Target: 2:1 reward-to-risk = 80 paise above entry, at 109.25. Potential gain = 80 × ₹10 × 2 = ₹1,600 before charges.
| Item | Value (hypothetical) |
|---|---|
| Entry | 108.45 |
| Stop | 108.05 (40 paise) |
| Target | 109.25 (80 paise) |
| ₹ per paise per lot | ₹10 |
| Lots | 2 |
| Risk | ₹800 |
| Reward at target | ₹1,600 |
Notice what the example does not say: it does not claim the trade wins. A hidden divergence setup only tells you the trend has a reason to resume. The stop is there because sometimes it does not.
The same arithmetic works on USD/INR, where one lot is US$1,000. Our guide on how to trade USD/INR explains the contract and its narrower daily ranges, which usually mean smaller paise stops.
Common mistakes with hidden divergence
- Trading it without a trend. In a range, every pullback can look like a divergence. If you cannot describe the trend in one sentence, skip the setup.
- Reading it backwards. A lower RSI low in an uptrend is a hidden bullish signal, not a bearish one. Mixing up the types leads to countertrend trades.
- Using unconfirmed swing points. Drawing lines to the current, still-forming candle produces signals that vanish. Wait for the swing to complete.
- Entering without a trigger. Divergence describes momentum; it is not an entry. Buying while price is still falling often means a larger stop or a stopped-out trade.
- Ignoring event risk. ECB decisions, US jobs data and RBI announcements can blow through technical levels. Check the calendar before entry.
- Sizing by lots instead of rupees. Two lots of EUR/INR with a 40-paise stop risk ₹800; the same two lots with a 120-paise stop risk ₹2,400.
- Trusting auto-divergence indicators blindly. Some scripts repaint and show signals in hindsight that were not visible live.
FAQs
Is hidden divergence bullish or bearish?
It can be either. Hidden bullish divergence forms in an uptrend when price makes a higher low but the oscillator makes a lower low, suggesting the uptrend may continue. Hidden bearish divergence forms in a downtrend when price makes a lower high but the oscillator makes a higher high, suggesting the downtrend may continue.
Which indicator is best for hidden divergence?
RSI and MACD are the most common. RSI (14) reacts faster and shows more setups, while MACD reacts slower and highlights larger swings. Many traders spot the setup on RSI and use MACD or price structure as a second check. No single indicator is reliable alone; trend context matters more than the choice of oscillator.
Is hidden divergence more reliable than regular divergence?
Neither is reliable on its own, and there is no single verified win rate for either. Hidden divergence trades with the existing trend, which some traders prefer because the trend is already established. Regular divergence aims to catch reversals, which can offer larger moves but more false signals in strong trends.
What timeframe works best for a hidden divergence strategy?
Many traders use the 1-hour or 4-hour chart for entries and the daily or 4-hour chart for trend direction. Very low timeframes produce many signals with more noise and higher relative costs. For NSE currency futures, which trade from 9:00 am to 5:00 pm IST, the 1-hour chart gives enough bars per session to spot clean swings.
Can I use hidden divergence on USD/INR futures?
Yes, with the same rules, but adjust for USD/INR’s relatively narrow daily ranges. Stops and targets are often measured in tens of paise. One USD/INR lot is US$1,000, so each paise is worth ₹10 per lot. Also watch for RBI intervention, which can cap or reverse moves near key levels.
Do I need both RSI and MACD to confirm hidden divergence?
No. One oscillator is enough to identify the setup. Adding MACD can filter some weak signals, but requiring both also reduces the number of trades. Many traders get more value from a higher-timeframe trend check and a clear trigger candle than from stacking a second oscillator.
Conclusion
A hidden divergence strategy turns a familiar oscillator into a trend-continuation tool. Look for a higher low in price with a lower low in RSI or MACD during an uptrend, or the mirror image in a downtrend, and only act when the trend is clear on a higher timeframe and a trigger candle confirms. Keep stops beyond the swing point and size every trade in rupees, using ₹10 per paise per lot on EUR/INR or USD/INR futures. Before placing your next trade, use our ATR stop-loss tool to set a stop buffer that matches current volatility.