Key Takeaways
- Harmonic patterns such as the Gartley, Bat and Butterfly are five-point XABCD structures defined by Fibonacci ratios.
- The Gartley completes at roughly the 78.6% retracement of XA, the Bat at 88.6%, and the Butterfly beyond X at about 127% of XA.
- Point D marks a Potential Reversal Zone, not a guaranteed turn, so traders wait for price confirmation before entering.
- Stops usually sit beyond X (or beyond D for the Butterfly), and common targets are the 38.2% and 61.8% retracements of AD.
- Indian residents can apply these patterns to NSE USD/INR or EUR/INR futures, sizing each trade with a fixed rupee risk.
Harmonic patterns Gartley traders talk about can look like a jumble of zigzags and decimals at first. The idea is simple: when several Fibonacci measurements cluster at one price, that area may act as a turning point. This guide is for Indian retail traders who know basic retracements and want a rule-based reversal setup. You will learn the XABCD structure, the commonly cited ratios for the Gartley, Bat and Butterfly, the Potential Reversal Zone, and entry, stop and target planning, finishing with a hypothetical USD/INR futures trade for a ₹1,00,000 account.
What are harmonic patterns and how does the Gartley work?
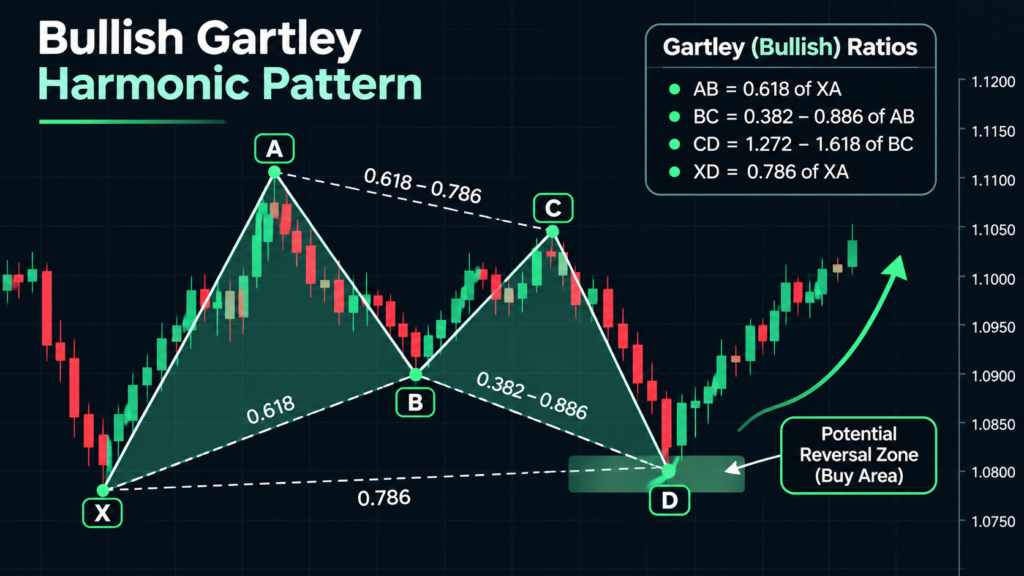
Harmonic patterns are price structures with five turning points, labelled X, A, B, C and D, where each swing must retrace or extend the previous one by specific Fibonacci ratios. The Gartley is the original: B retraces about 61.8% of XA, and D completes near the 78.6% retracement of XA, inside the X-to-A range.
A Fibonacci ratio is a proportion from the Fibonacci sequence, such as 0.618 or 1.618, used to compare one price swing with another. For a refresher, see our guide to Fibonacci retracement in forex.
The pattern is named after H.M. Gartley, who sketched it in his 1935 book Profits in the Stock Market. His original had no Fibonacci arithmetic; later analysts, notably Larry Pesavento, attached the ratios, and the Bat (introduced in 2001) and Butterfly followed as variations.
The XABCD structure in plain words
XA is the initial impulse, AB a pullback, BC a smaller counter-move, and CD the final leg into the reversal area. In a bullish pattern, X is a low, A a high, and D a low from which price is expected to rise; the shape resembles an M. A bearish pattern is the mirror image, shaped like a W. Harmonic setups sit alongside the classic forex chart patterns, but rely far more on measurement than on visual shape.
Gartley pattern rules: the ratios that define it
Sources agree on the core Gartley numbers but differ slightly on tolerances, so treat these as the commonly cited version rather than an official standard.
- B point: AB retraces about 61.8% of XA.
- C point: BC retraces 38.2% to 88.6% of AB. If C moves beyond A, the pattern is void.
- D point: D completes at about the 78.6% retracement of XA.
- CD leg: CD is typically a 127.2% to 161.8% extension of BC.
- Invalidation: a decisive break beyond X cancels the Gartley.
Many traders also look for an AB=CD structure, where CD roughly equals AB, finishing near the same zone. The more measurements agree, the stronger the zone.
Bat pattern and butterfly pattern forex rules
The Bat and Butterfly share the Gartley’s skeleton, but B’s depth and D’s location change. B usually decides which pattern you are looking at.
The Bat pattern
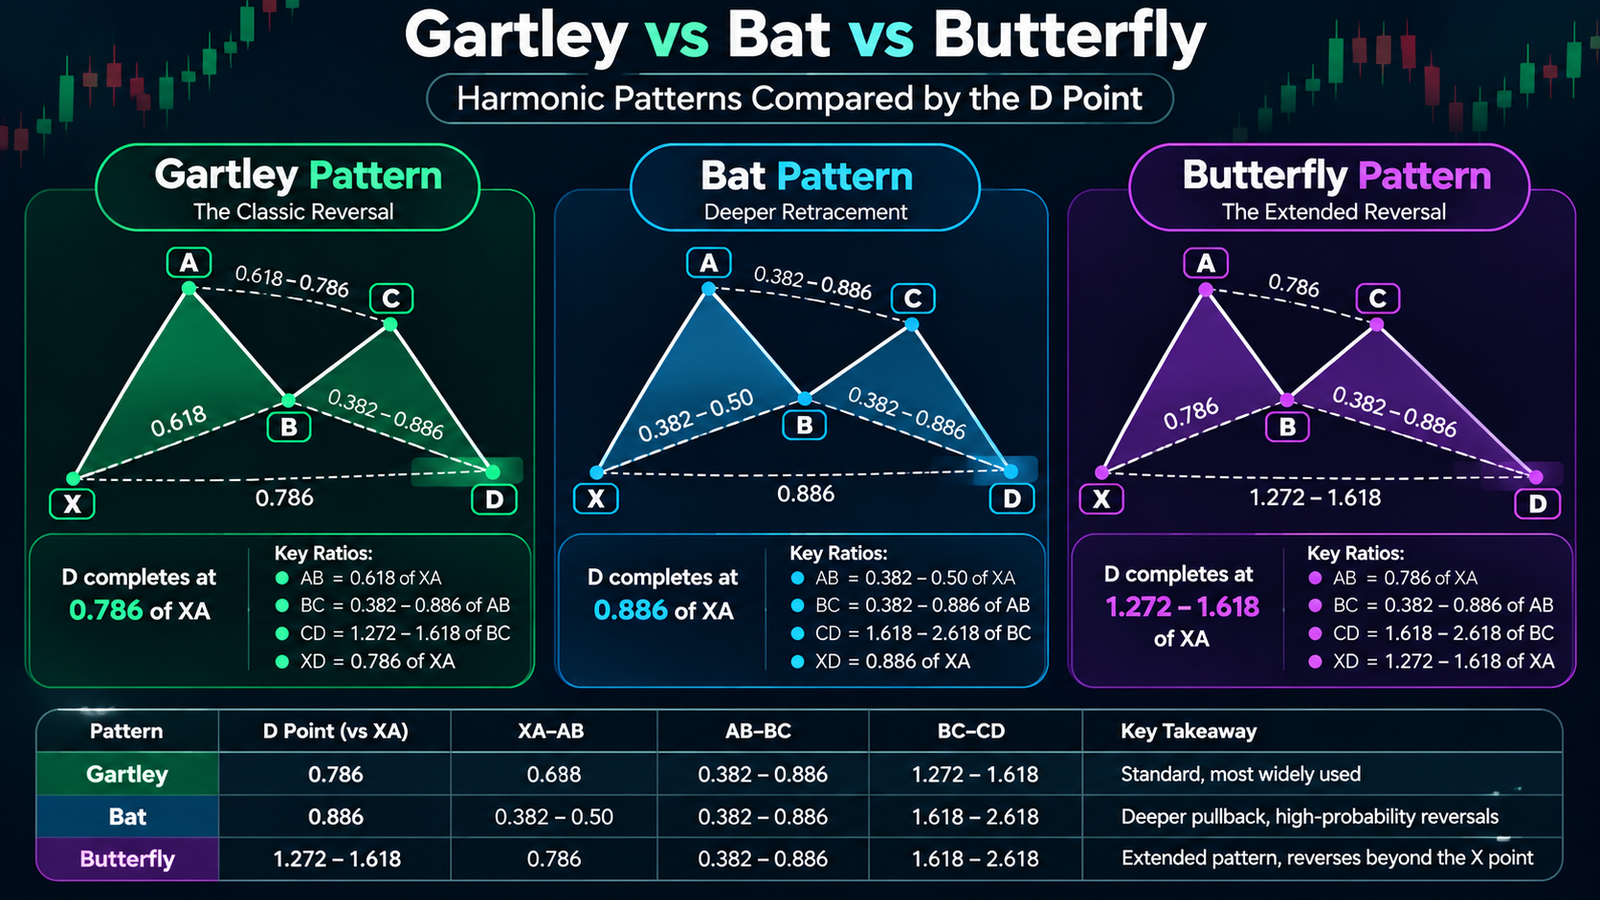
The bat pattern has a shallow B and a deep D. AB retraces 38.2% to 50% of XA; at 61.8% or deeper, it grades as a Gartley. C retraces 38.2% to 88.6% of AB. D completes at the 88.6% retracement of XA, still inside the range, with a BC projection usually of 161.8% to 261.8%. Because D is close to X, a stop beyond X is often relatively tight.
The Butterfly pattern
The Butterfly, the subject of most butterfly pattern forex searches, completes beyond X. B retraces about 78.6% of XA and C again retraces 38.2% to 88.6% of AB. D completes at an XA extension, most commonly 127%, with some sources allowing up to 161.8%. The BC projection is typically 161.8% to 261.8%, though one source narrows the ideal to 161.8%–224%. The stop usually goes beyond D or the 161.8% XA extension.
Harmonic Fibonacci ratios compared: Gartley vs Bat vs Butterfly
This table summarises the harmonic Fibonacci ratios most commonly cited in the sources below; expect small variations between authors and platforms.
| Measurement | Gartley | Bat | Butterfly |
|---|---|---|---|
| B (retracement of XA) | about 0.618 | 0.382–0.50 | about 0.786 |
| C (retracement of AB) | 0.382–0.886 | 0.382–0.886 | 0.382–0.886 |
| CD (extension of BC) | 1.272–1.618 | 1.618–2.618 | 1.618–2.618 |
| D (relative to XA) | 0.786 retracement | 0.886 retracement | 1.27 extension (up to 1.618) |
| D inside or beyond X? | Inside | Inside | Beyond |
| Typical stop area | Beyond X | Beyond X | Beyond D / 1.618 XA |
What is the Potential Reversal Zone?
The Potential Reversal Zone (PRZ) is the price area around D where several measurements overlap: the XA retracement, the BC extension and the AB=CD completion. It is a zone because they rarely land on the same tick, and a narrow PRZ is usually preferred.
Traders treat the PRZ as a place to watch, not to trade blindly. Confirmation often means a reversal candle such as a hammer or engulfing bar, oscillator divergence, or a break of the small swing inside the zone.
Entry, stop and target logic
- Entry: inside the PRZ after confirmation.
- Stop: beyond X for the Gartley and Bat, because a move past X invalidates the structure.
- Targets: traders often use the 38.2% and 61.8% retracements of AD, then point C or A.
Our guide to the risk-reward ratio in forex explains how to judge whether the first target justifies the risk.
Can Indian traders use harmonic patterns legally?
Yes, the patterns themselves are just analysis, but the venue matters. Indian residents may trade currency derivatives only on recognised Indian exchanges (NSE, BSE and MSE) in permitted pairs, through SEBI-registered brokers. Leveraged or margin forex on overseas online platforms using LRS remittances is not permitted, and the RBI maintains an Alert List of unauthorised forex platforms.
So EUR/USD or GBP/JPY chart examples are for learning; the trade you place should be on a permitted contract, as our list of legal currency pairs in India explains. Harmonic drawing tools and pattern scanners are available on most mainstream charting platforms.
NSE contract basics for the example
According to NSE’s specifications, one USD/INR futures lot is US$1,000 and one EUR/INR lot is €1,000. The tick size is 0.25 paise, contracts are cash-settled in rupees, and trading runs 9:00 am to 5:00 pm IST, Monday to Friday. With a US$1,000 lot, each 1 paisa move equals ₹10 per lot. See how to trade USD/INR for more.
How to trade a Gartley pattern step by step
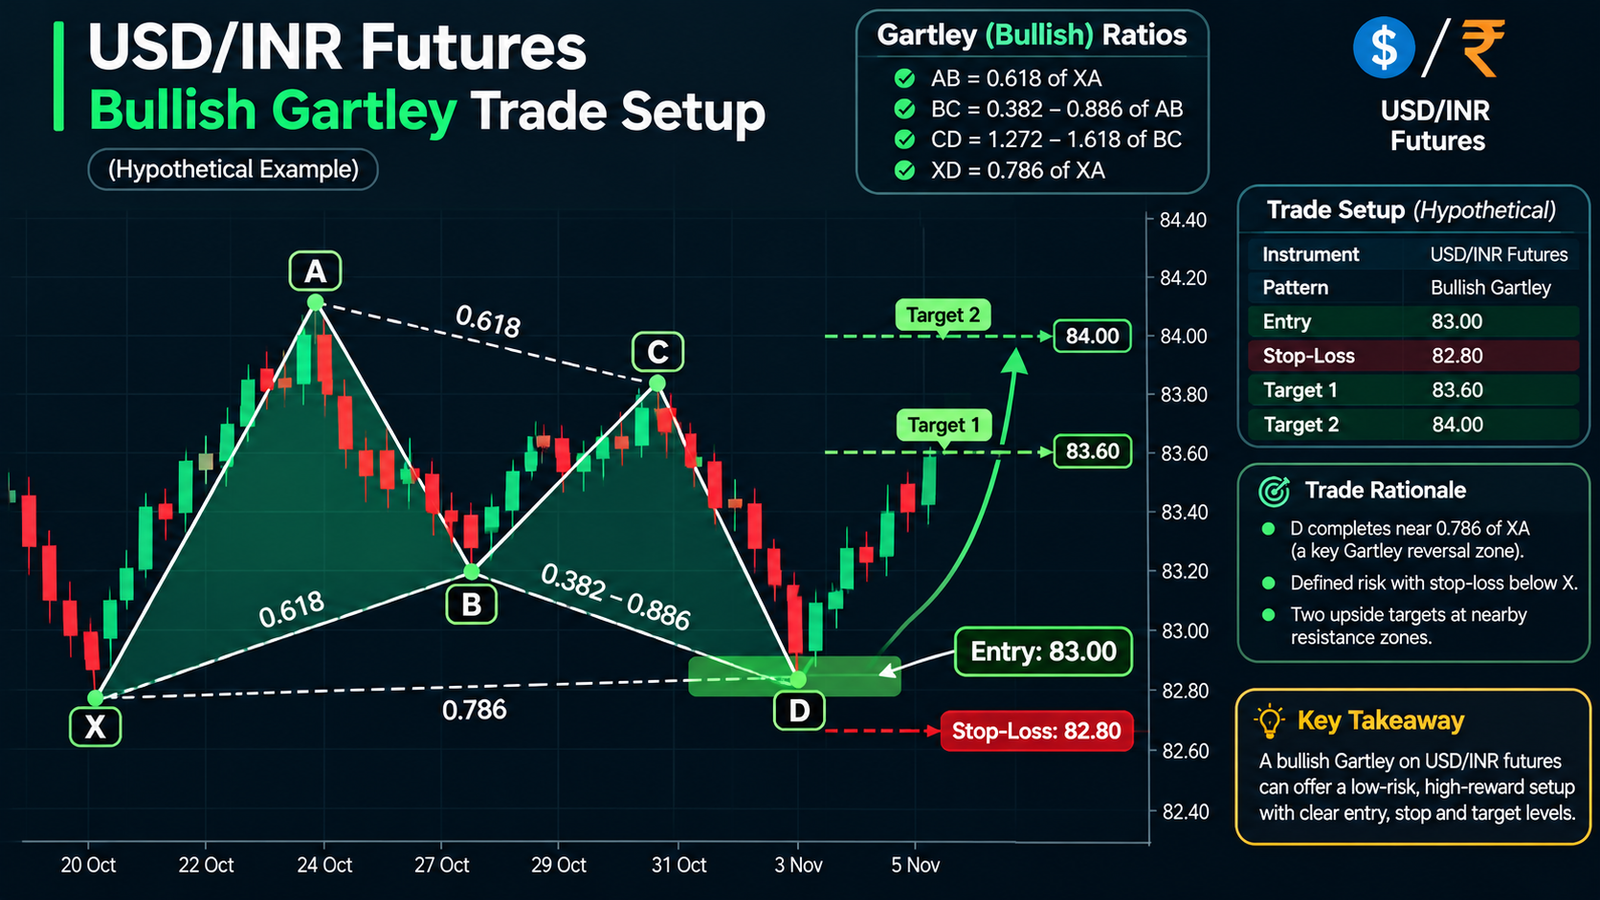
Example (hypothetical): a trader with ₹1,00,000 capital risks 1% (₹1,000) on a bullish Gartley in NSE USD/INR futures. All prices below are invented for illustration and are not current market levels.
- Mark X and A. X is a swing low at 86.0000 and A a swing high at 87.0000, so XA is 100 paise.
- Confirm B. Price pulls back to 86.3800, a 62% retracement of XA.
- Confirm C. Price bounces to 86.7600, about 61% of AB, inside the 38.2%–88.6% band.
- Project D. The 78.6% retracement of XA is 86.2140, so the trader marks 86.2150 (nearest tick) as the PRZ core. CD would be 54.5 paise against a BC of 38 paise, an extension of about 1.43.
- Wait for confirmation. Price prints a bullish reversal candle in the zone and the trader buys at 86.2200.
- Place the stop. The stop goes at 85.9800, just below X and 24 paise below entry: ₹240 risk per lot.
- Size the position. ₹1,000 ÷ ₹240 = 4.17, so the trader rounds down to 4 lots, risking ₹960.
- Set targets. AD is 78.5 paise. Target 1 at the 38.2% retracement of AD is about 86.5150 (gain of 29.5 paise, or ₹1,180 on 4 lots). Target 2 at the 61.8% retracement is about 86.7000 (gain of 48 paise, or ₹1,920 on 4 lots, about 2R).
- Manage the trade. Many traders close part at Target 1 and move the stop to entry. A close below X means the pattern has failed.
These figures ignore brokerage, charges, taxes and slippage, and margin is set by the exchange and broker. Run your own numbers through our forex position size calculator. The same steps work for EUR/INR, where a €1,000 lot also makes 1 paisa worth ₹10.
Common mistakes with harmonic patterns
Most problems come from forcing a pattern, not from the ratios.
- Labelling after the fact. Adjusting X or A until the numbers fit is curve-fitting. Pick clear swings first, then measure.
- Ignoring B. A 0.50 B with D at 0.786 is neither a clean Gartley nor a clean Bat.
- Entering without confirmation. Strong trends can slice straight through the PRZ.
- Oversizing a “perfect” setup. No pattern has a guaranteed outcome, so keep the same percentage risk.
- Trading through big events. RBI, Fed or US data releases can move USD/INR sharply past technical levels.
- Trusting scanners blindly. Tools use their own tolerances, so check each ratio yourself.
For a broader grounding in retracements, extensions and reversals, CME Group’s technical analysis course is a free, exchange-run resource.
FAQs
What is the main difference between a Gartley and a Bat pattern?
The depth of the B point and the D point separate them. In a Gartley, B retraces about 61.8% of XA and D completes near 78.6%. In a Bat, B is shallower at 38.2% to 50%, and D completes deeper at about 88.6% of XA. Both complete inside the XA range.
Why does the Butterfly pattern complete beyond point X?
The Butterfly is defined by an extension rather than a retracement at D. After a deep B near 78.6% of XA, the CD leg carries price past X to roughly 127% of XA, and some sources allow up to 161.8%. Because D lies beyond X, the stop is placed beyond D rather than beyond X.
Are harmonic Fibonacci ratios the same in every source?
No. The core numbers, such as 0.618 and 0.786 for the Gartley or 0.886 for the Bat, are widely shared, but tolerances and some projection ranges differ between authors and charting tools. Pick one published set of rules and use it consistently.
Which timeframe works best for harmonic patterns?
There is no single best timeframe. Many traders prefer hourly, four-hour or daily charts because swing points are clearer and less affected by noise. On very short timeframes, small spikes can create patterns that look valid but mean little. Make sure the stop distance suits your account.
Can I trade harmonic patterns on EUR/USD from India?
Indian residents cannot legally trade EUR/USD through overseas leveraged platforms. Cross-currency pairs such as EUR/USD are only allowed where offered on recognised Indian exchanges, through SEBI-registered brokers. You can still study harmonic patterns on any chart and apply the same rules to permitted contracts such as NSE USD/INR or EUR/INR futures.
Do harmonic patterns work without confirmation?
They can, but entering blindly at D carries more risk because strong trends often push through the reversal zone. Many traders wait for a reversal candle, momentum divergence or a small break of structure inside the PRZ, accepting a slightly worse entry.
Conclusion
Harmonic patterns Gartley, Bat and Butterfly give you a structured way to find possible reversal areas, but they are measurement tools, not predictions. Learn the B and D ratios, treat the Potential Reversal Zone as a place to watch, and wait for confirmation. Keep the stop where the pattern is invalidated, and let a fixed rupee risk decide your lot count. Before your next USD/INR or EUR/INR setup, run the numbers through our forex position size calculator.