Introduction
Most charts show volume as bars along the bottom, telling you how much traded in each time period. That is useful, but it hides an important question: at which prices did most of the trading actually happen?
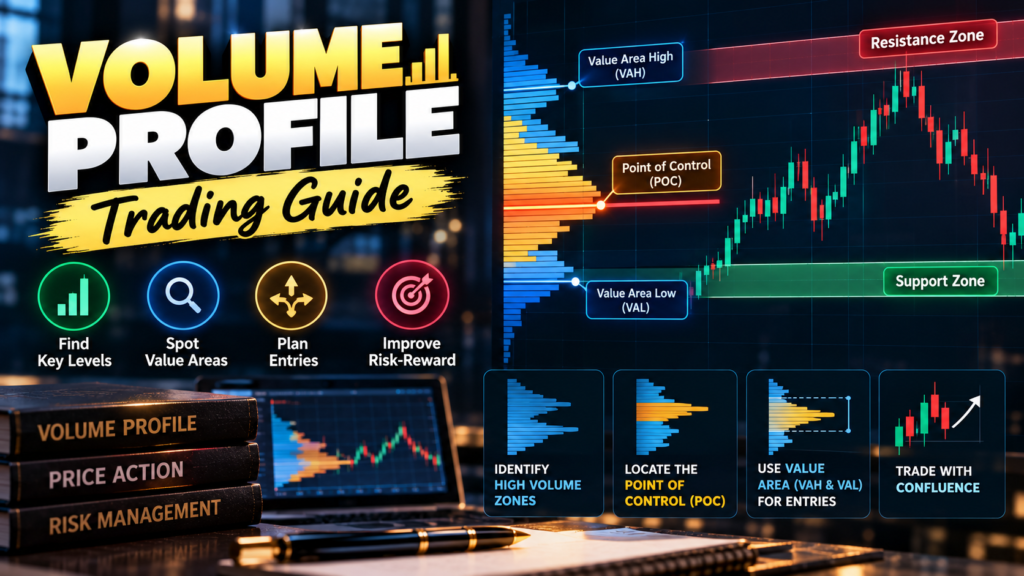
Volume profile answers that question. It plots volume horizontally against price, so you can see where buyers and sellers agreed on value and where price moved through quickly with little interest. Volume profile trading uses this information to find stronger support and resistance, better entries and more logical stop-loss levels.
This guide covers:
- What volume profile is and how it differs from normal volume
- Key terms: POC, value area, HVN and LVN
- Types of volume profile and common profile shapes
- Practical volume profile trading setups with entry, stop and target rules
- A worked example and common mistakes
- How to use it in forex and Indian currency futures
What Is Volume Profile?
Volume profile is a charting tool that displays the total volume traded at each price level over a chosen period. It appears as a horizontal histogram on the side of the chart. Long bars show prices where a lot of trading took place; short bars show prices where little trading occurred.
The idea comes from auction market theory. Markets move to find prices where buyers and sellers are both willing to trade. Prices with heavy volume represent accepted value. Prices with light volume represent rejection, where the market moved on quickly.
Volume profile trading is the practice of reading this distribution to decide where price is likely to stall, reverse or accelerate.
Volume Profile vs Traditional Volume
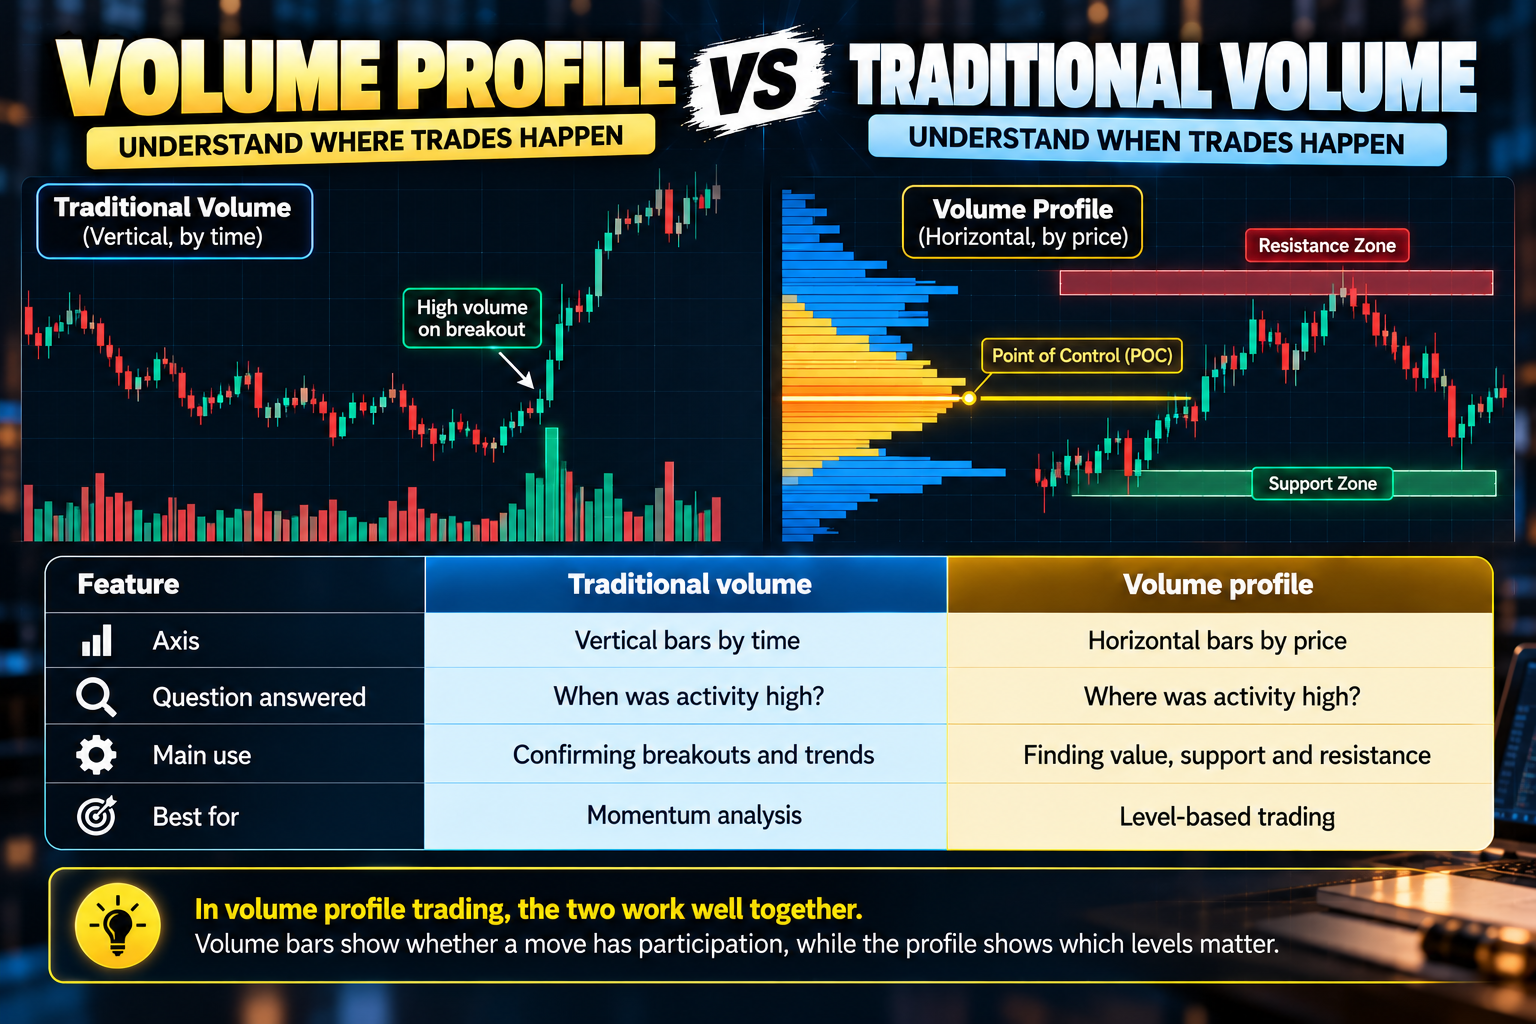
| Feature | Traditional volume | Volume profile |
|---|---|---|
| Axis | Vertical bars by time | Horizontal bars by price |
| Question answered | When was activity high? | Where was activity high? |
| Main use | Confirming breakouts and trends | Finding value, support and resistance |
| Best for | Momentum analysis | Level-based trading |
In volume profile trading, the two work well together. Volume bars show whether a move has participation, while the profile shows which levels matter.
Key Terms in Volume Profile Trading
Point of Control (POC)
The POC is the single price level with the highest traded volume in the profile. It is the “fairest” price for that period, where the most business took place. Price often gravitates back towards the POC, and it frequently acts as support or resistance.
Value Area (VA)
The value area is the price range where a set percentage of volume, usually 70%, traded. It has two edges:
- Value Area High (VAH): The top of the value area.
- Value Area Low (VAL): The bottom of the value area.
Trading inside the value area suggests balance. Trading outside it suggests the market is testing new prices.
High Volume Nodes (HVN)
HVNs are peaks in the profile where lots of trading occurred. They act like magnets and often slow price down, creating congestion and support or resistance.
Low Volume Nodes (LVN)
LVNs are valleys in the profile where little trading occurred. Price tends to move quickly through them, and they often mark the boundaries between areas of value. Many traders place stops beyond LVNs or watch them for fast breakouts.
Types of Volume Profile Used in Volume Profile Trading
| Type | What it shows | Typical use |
|---|---|---|
| Session volume profile | Volume for each trading session or day | Intraday levels from the previous session |
| Visible range volume profile | Volume for all bars visible on screen | Quick overview of key levels |
| Fixed range volume profile | Volume between two points you choose | Analysing a specific swing, range or trend leg |
| Composite profile | Volume across many sessions combined | Long-term value areas for swing trading |
For most traders, the fixed range and session profiles are the most useful starting points in volume profile trading.
Profile Shapes in Volume Profile Trading
- D-shape (balanced): Volume concentrated in the middle, with a POC near the centre. The market is in balance, and range trading tactics often work.
- P-shape: Heavy volume at the top with a thin tail below. Often appears after short covering or buying pressure, suggesting buyers were in control.
- b-shape: Heavy volume at the bottom with a thin tail above. Often appears after long liquidation or selling pressure.
- Double distribution (B-shape): Two separate high-volume areas with an LVN between them. Shows the market moved from one value area to another.
- Thin or elongated profile: Little volume at any level, typical of a strong trend day.
Reading the shape helps you decide whether to expect mean reversion or continuation.
Volume Profile Trading Setups
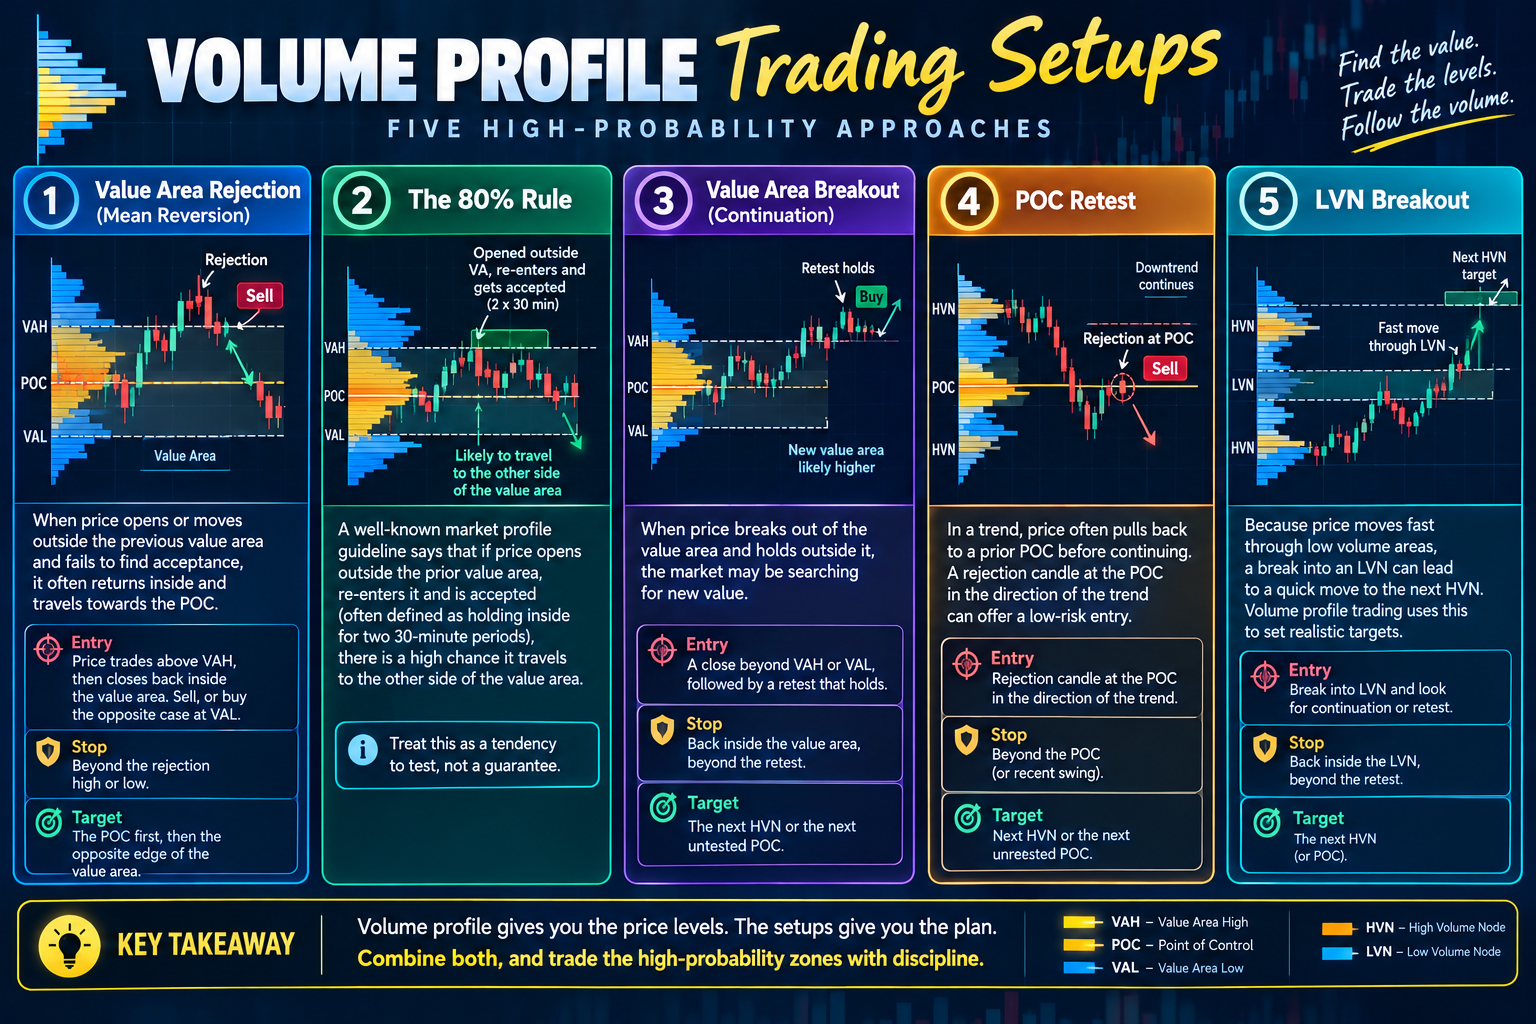
1. Value Area Rejection (Mean Reversion)
When price opens or moves outside the previous value area and fails to find acceptance, it often returns inside and travels towards the POC.
- Entry: Price trades above VAH, then closes back inside the value area. Sell, or buy the opposite case at VAL.
- Stop: Beyond the rejection high or low.
- Target: The POC first, then the opposite edge of the value area.
2. The 80% Rule
A well-known market profile guideline says that if price opens outside the prior value area, re-enters it and is accepted (often defined as holding inside for two 30-minute periods), there is a high chance it travels to the other side of the value area. Treat this as a tendency to test, not a guarantee.
3. Value Area Breakout (Continuation)
When price breaks out of the value area and holds outside it, the market may be searching for new value.
- Entry: A close beyond VAH or VAL, followed by a retest that holds.
- Stop: Back inside the value area, beyond the retest.
- Target: The next HVN or the next untested POC.
4. POC Retest
In a trend, price often pulls back to a prior POC before continuing. A rejection candle at the POC in the direction of the trend can offer a low-risk entry.
5. LVN Breakout
Because price moves fast through low volume areas, a break into an LVN can lead to a quick move to the next HVN. Volume profile trading uses this to set realistic targets.
Stop-Loss and Target Placement in Volume Profile Trading
- Stops: Place them beyond the HVN or value area edge that protects your trade, ideally on the far side of an LVN where price should not return if your idea is correct.
- Targets: Use the POC, the opposite value area edge or the next HVN. These levels are where price is likely to slow down.
- Risk-reward: Check that the distance to target is at least 1.5 to 2 times the stop distance before entering.
Worked Example of Volume Profile Trading
Suppose you apply a session volume profile to EUR/USD. Yesterday’s profile shows:
- VAH: 1.1665
- POC: 1.1640
- VAL: 1.1615
Today, price opens at 1.1680, above the value area.
- In the London session, price fails to push higher and closes back below 1.1665 on the 30-minute chart.
- The next 30-minute candle also holds inside the value area, signalling acceptance.
- The trader sells at 1.1660, with a stop at 1.1688, above the session high (28 pips of risk).
- The first target is the POC at 1.1640 (20 pips). The second target is VAL at 1.1618 (42 pips).
- Half the position is closed at 1.1640, and the stop moves to break-even.
- Price reaches 1.1618, and the remaining position is closed.
The average gain is 31 pips on 28 pips of risk, about 1.1 times the risk. This shows why traders should check risk-reward first: a tighter stop or skipping the trade might be better when the value area is narrow.
This example is illustrative and uses hypothetical prices.
Volume Profile Trading in Forex: The Tick Volume Issue
Spot forex is decentralised, so there is no single exchange recording all trades. Volume profiles on forex charts usually use tick volume, which counts price changes from your broker’s feed rather than actual traded contracts. Tick volume often tracks real activity reasonably well, but it is an approximation and varies between brokers.
For more reliable data, many traders study the profile of exchange-traded currency futures, such as CME euro futures, and apply those levels to the spot chart. This is an important caveat for anyone using volume profile trading on forex pairs.
Volume Profile Trading for Indian Traders
Indian traders have an advantage here: currency futures on NSE and BSE are exchange-traded, so their volume is real, centralised data rather than tick volume. Applying a volume profile to USD/INR futures can reveal where institutions and hedgers have been most active.
A few practical points:
- USD/INR often trades in tight ranges because the RBI smooths sharp moves, so balanced D-shaped profiles are common.
- Each 1-paise move in USD/INR futures is worth ₹10 per lot, so a 15-paise move from VAH to POC is worth ₹150 per lot before costs.
- Use the near-month contract, where most volume is concentrated, and be careful around expiry when volume shifts to the next month.
- The same tools work on Nifty and Bank Nifty futures for traders who also follow equity derivatives.
Indian residents should trade currencies only through recognised exchanges via SEBI-registered brokers. Leveraged forex trading on offshore CFD platforms is not permitted under FEMA.
Combining Volume Profile With Other Tools
- VWAP: When the POC and VWAP sit close together, that level becomes especially strong.
- Price action: Pin bars and engulfing candles at VAH, VAL or POC improve timing.
- Market structure: Use higher-timeframe trend direction to choose between mean reversion and continuation setups.
- Order flow: Advanced traders use footprint charts to see buying and selling inside each level.
Keep the chart clean. Volume profile trading works best when the profile is the main tool and others simply confirm.
Common Volume Profile Trading Mistakes
- Using the wrong range: A fixed range profile drawn over random bars gives meaningless levels. Anchor it to a clear swing, range or session.
- Treating levels as exact lines: POC and value area edges are zones. Allow for small overshoots.
- Ignoring context: Fading VAH in a strong trend often fails. Check the trend and profile shape first.
- Trusting tick volume blindly: In spot forex, remember volume is an estimate.
- Overloading the chart: Too many profiles and indicators create confusion.
- Skipping risk-reward checks: Narrow value areas may not offer enough room after costs.
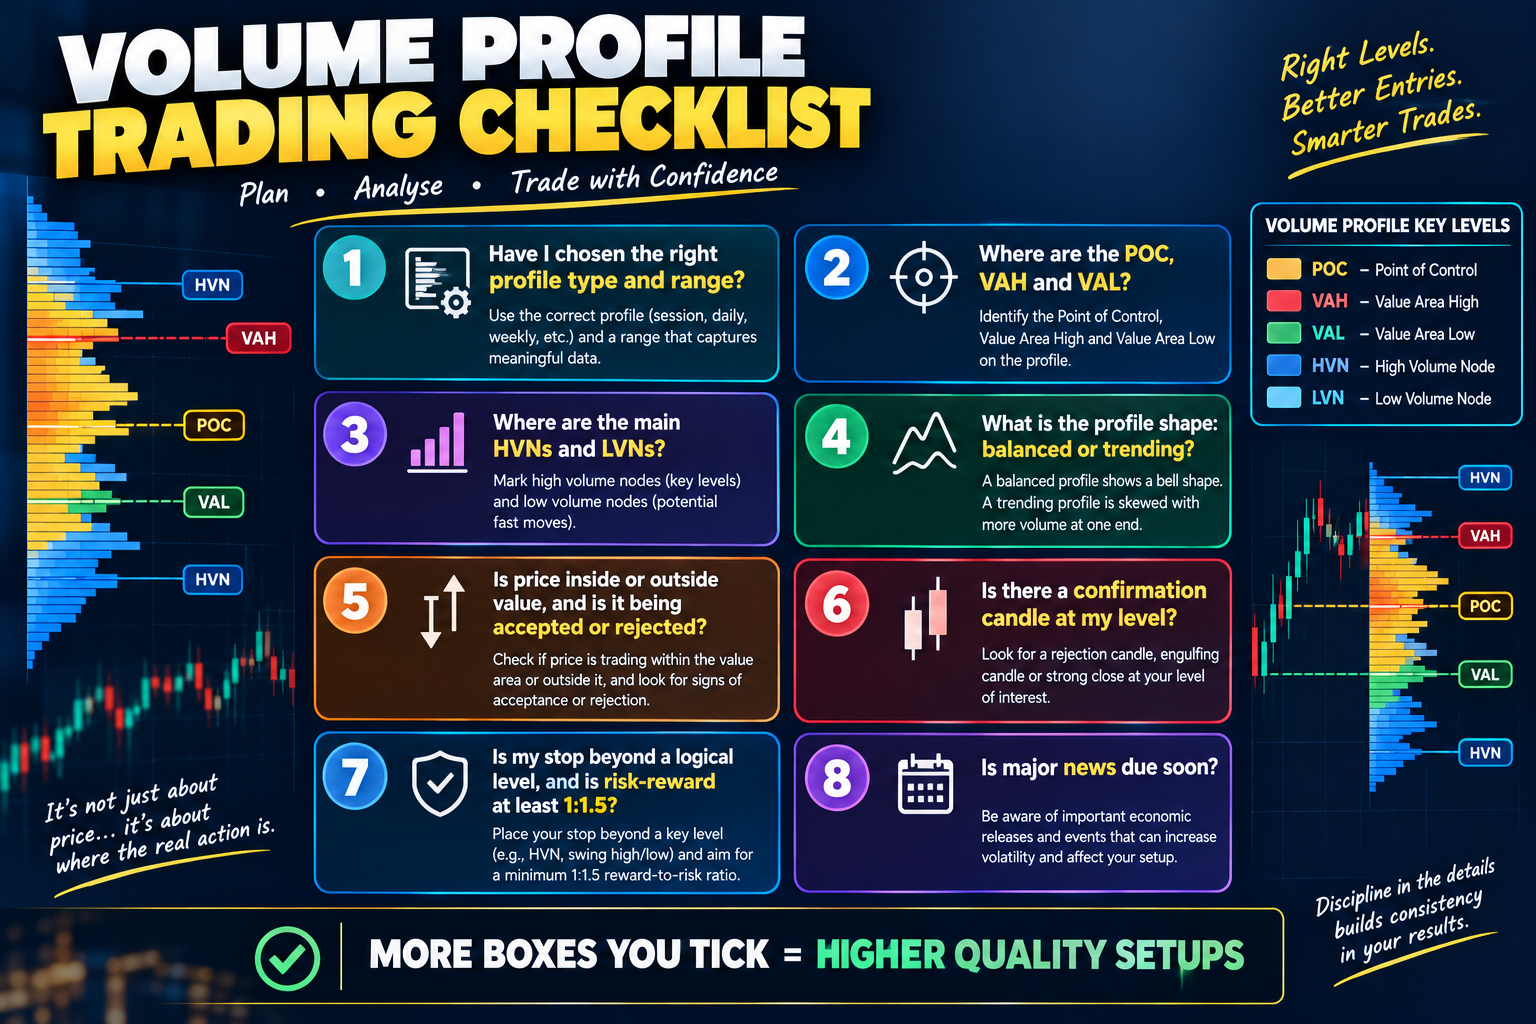
Volume Profile Trading Checklist
- Have I chosen the right profile type and range?
- Where are the POC, VAH and VAL?
- Where are the main HVNs and LVNs?
- What is the profile shape: balanced or trending?
- Is price inside or outside value, and is it being accepted or rejected?
- Is there a confirmation candle at my level?
- Is my stop beyond a logical level, and is risk-reward at least 1:1.5?
- Is major news due soon?
FAQs
What is volume profile trading?
It is a method that uses a horizontal histogram of volume at each price to find value areas, support and resistance, and to plan entries, stops and targets.
What is the point of control?
The POC is the price with the highest traded volume in the chosen period. Price often returns to it and reacts around it.
What does the value area show?
It shows the price range where about 70% of volume traded, bounded by the value area high and value area low.
Does volume profile work in forex?
Yes, but spot forex uses tick volume, which is an approximation. Exchange-traded currency futures provide more reliable volume data.
Which timeframe is best?
Intraday traders often use session profiles on 5 to 30-minute charts. Swing traders use composite or fixed range profiles on 4-hour and daily charts.
Conclusion
Volume profile trading shifts your focus from when the market traded to where it traded. By identifying the point of control, the value area and the high and low volume nodes, you can find levels that matter to large participants and plan trades with clearer logic.
Start simple: mark yesterday’s POC, VAH and VAL, watch how price reacts to them and record the results in a trading journal. Combine the profile with trend context and price action, keep your risk small and practise on a demo account before trading live.