Introduction
You spot a clean breakout from the Asian range and jump in. Minutes later, price reverses, takes out your stop loss and races off in the opposite direction. If that sounds familiar, you have met the ICT Judas swing.
The term comes from Michael J. Huddleston, known as the Inner Circle Trader (ICT). It describes a false move early in a trading session that tricks traders into the wrong direction before the real move begins. Understanding it can help you avoid being trapped and, with practice, trade with the move that follows.
This guide covers:
- What the ICT Judas swing is and why it happens
- When it typically forms during the trading day
- How to identify and confirm it
- A step-by-step trading model, an example, common mistakes and limitations
What Is the ICT Judas Swing?
The ICT Judas swing is a sharp, deceptive price move that runs against the day’s true direction, usually near the start of a session. It is named after Judas, the biblical figure associated with betrayal, because the move “betrays” traders who follow it.
On a bullish day, the Judas swing is typically a quick drop below the opening price or a key low. On a bearish day, it is a quick rally above the open or a key high. Once the fake move has taken out stop losses and pulled in breakout traders, price reverses and moves strongly in the real direction.
In ICT’s framework, this is the “manipulation” phase of the Power of 3 model, which describes a trading period as accumulation, manipulation and distribution.
| Power of 3 phase | What happens | Role of the Judas swing |
|---|---|---|
| Accumulation | Price ranges quietly near the open | Builds liquidity above and below the range |
| Manipulation | A false move breaks the range | This is the Judas swing |
| Distribution | Price expands in the true direction | Confirms the Judas swing was a trap |
Why the ICT Judas Swing Happens
The idea behind the ICT Judas swing is liquidity. Large orders need other traders on the opposite side. Clusters of stop losses and breakout orders sit just above recent highs and below recent lows. When price runs into these levels, those orders are triggered, providing the liquidity that bigger players can use to fill their own positions.
In smart money concepts, this is often called a liquidity sweep or stop hunt. Whether or not you believe large institutions deliberately engineer these moves, the pattern itself is easy to observe: price frequently pokes beyond an obvious level, then reverses sharply.
Common liquidity targets for a Judas swing include:
- The high or low of the Asian session range
- The previous day’s high or low
- Equal highs or equal lows, which attract clusters of stops
- Round numbers and obvious support or resistance levels
When Does the ICT Judas Swing Happen?
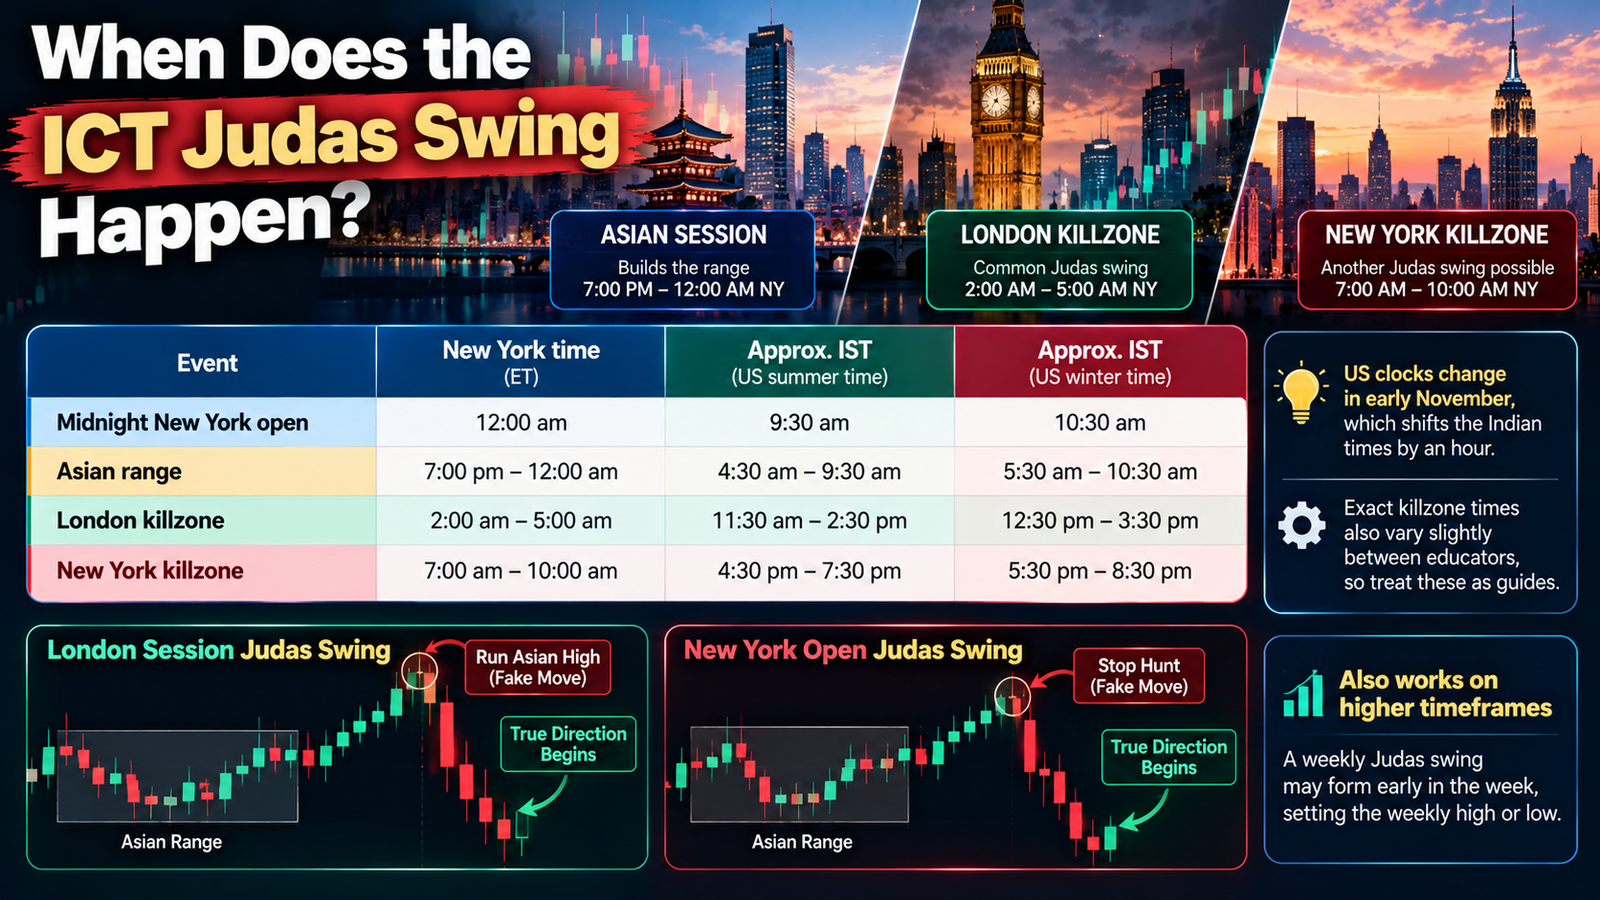
ICT teaches the Judas swing mainly in the context of the trading day in New York time. The most common window is the London session, after the Asian range has formed.
| Event | New York time | Approx. IST (US summer time) | Approx. IST (US winter time) |
|---|---|---|---|
| Midnight New York open | 12:00 am | 9:30 am | 10:30 am |
| Asian range | 7:00 pm – 12:00 am | 4:30 am – 9:30 am | 5:30 am – 10:30 am |
| London killzone | 2:00 am – 5:00 am | 11:30 am – 2:30 pm | 12:30 pm – 3:30 pm |
| New York killzone | 7:00 am – 10:00 am | 4:30 pm – 7:30 pm | 5:30 pm – 8:30 pm |
US clocks change in early November, which shifts the Indian times by an hour. Exact killzone times also vary slightly between educators, so treat these as guides.
The ICT Judas swing often appears early in the London killzone, as price runs the Asian high or low. A second version can appear at the New York open, especially around major US data releases. The same idea also works on higher timeframes: a weekly Judas swing may form early in the week, setting the weekly high or low.
How to Identify an ICT Judas Swing
A true ICT Judas swing usually has these features:
- A clear opening reference: Price starts near the midnight New York open or the session open.
- A defined range: The Asian session creates a range with an obvious high and low.
- A quick move against the bias: Price breaks out of the range in the opposite direction to the expected daily trend.
- A liquidity sweep: The move runs through a key level, such as the Asian low or previous day’s low.
- Rejection: Price stalls, leaves a wick and fails to continue.
- A reversal: Price moves back through the opening price and the broken level.
The most important point is that you only know a move was a Judas swing after the reversal confirms it. Until then, a break of the range could simply be a genuine breakout.
Confirmation Signals
To avoid guessing, many traders wait for one or more of these confirmations before acting on an ICT Judas swing:
- Market structure shift: On a lower timeframe, such as 5 or 15 minutes, price breaks a recent swing high after sweeping a low (or a swing low after sweeping a high).
- Displacement: A strong, fast candle or series of candles in the new direction, showing real buying or selling pressure.
- Fair value gap: The displacement leaves a gap between candles, which often acts as a zone for entries on a pullback.
- Reclaiming the open: Price moves back above the opening price on a bullish day, or below it on a bearish day.
- Higher-timeframe alignment: The reversal agrees with your daily or weekly bias.
The Role of Daily Bias
You cannot trade an ICT Judas swing without a view on direction. If you expect the day to be bullish, you look for a fake move down first. If you expect it to be bearish, you look for a fake move up.
Traders typically build daily bias from:
- Higher-timeframe market structure (higher highs and lows, or lower highs and lows)
- Where price sits relative to recent ranges, such as premium or discount zones
- Untouched liquidity pools or fair value gaps on the daily chart
- Major economic events and central bank decisions
Without a bias, the fake move and the real move look the same. Bias is what turns the Judas swing from a confusing whipsaw into a tradable setup.
A Step-by-Step ICT Judas Swing Trading Model
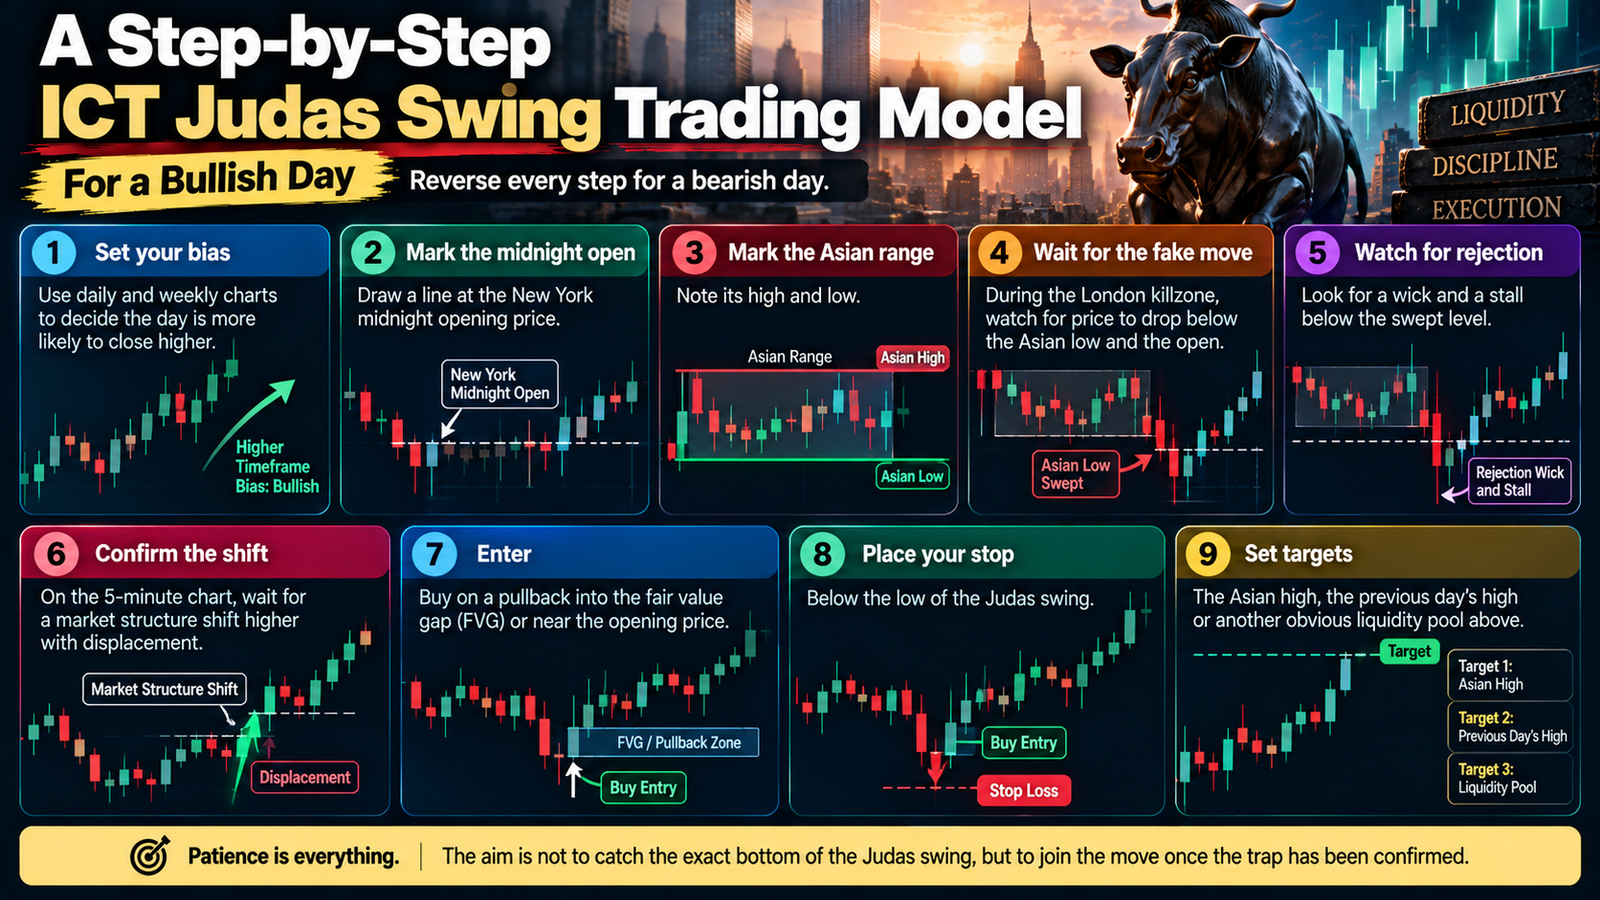
Here is a simple model for a bullish day. Reverse every step for a bearish day.
- Set your bias: Use daily and weekly charts to decide the day is more likely to close higher.
- Mark the midnight open: Draw a line at the New York midnight opening price.
- Mark the Asian range: Note its high and low.
- Wait for the fake move: During the London killzone, watch for price to drop below the Asian low and the open.
- Watch for rejection: Look for a wick and a stall below the swept level.
- Confirm the shift: On the 5-minute chart, wait for a market structure shift higher with displacement.
- Enter: Buy on a pullback into the fair value gap or near the opening price.
- Place your stop: Below the low of the Judas swing.
- Set targets: The Asian high, the previous day’s high or another obvious liquidity pool above.
Patience is everything. The aim is not to catch the exact bottom of the Judas swing, but to join the move once the trap has been confirmed.
Example on EUR/USD
Imagine your daily bias on EUR/USD is bullish. The midnight New York open is 1.1200, and the Asian range runs from 1.1190 to 1.1210.
Early in the London killzone, price drops sharply to 1.1176, taking out the Asian low and the previous day’s low. That is the ICT Judas swing. A long wick forms, and price quickly climbs back above 1.1190. On the 5-minute chart, it breaks a recent swing high, leaving a fair value gap between 1.1186 and 1.1191.
A trader buys at 1.1189 with a stop at 1.1172. Price reclaims the open, rallies through the New York session and reaches 1.1245, near the previous day’s high. The risk was 17 pips and the reward was 56 pips, a ratio of more than 1:3.
This example is illustrative and uses hypothetical prices.
ICT Judas Swing vs a Genuine Breakout
| Feature | Judas swing | Genuine breakout |
|---|---|---|
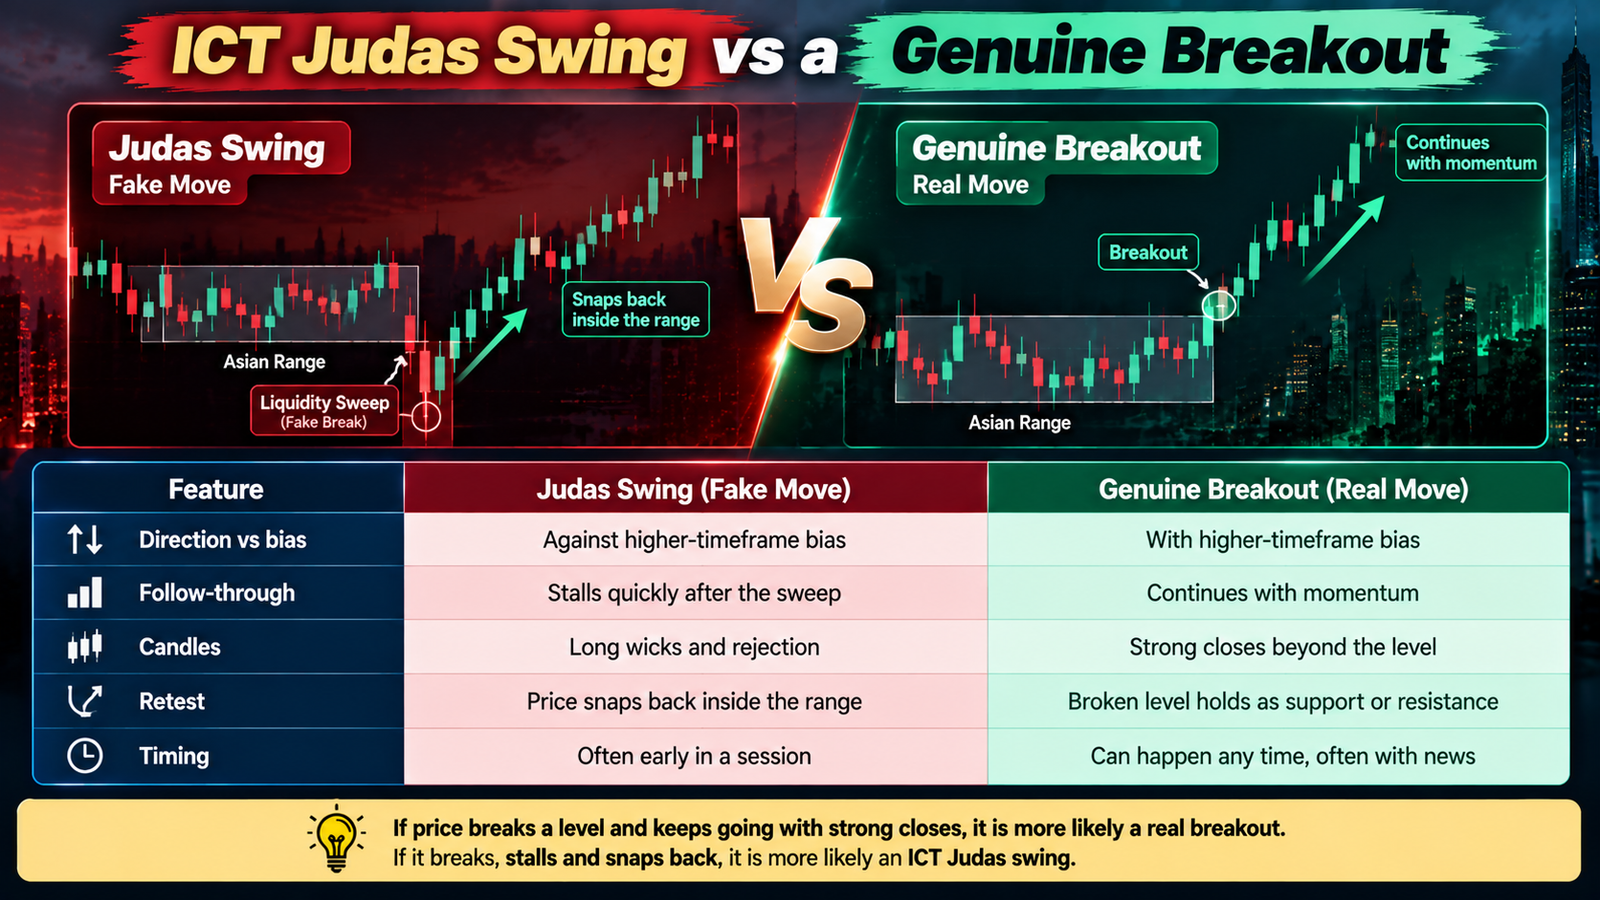
| Direction vs bias | Against higher-timeframe bias | With higher-timeframe bias |
| Follow-through | Stalls quickly after the sweep | Continues with momentum |
| Candles | Long wicks and rejection | Strong closes beyond the level |
| Retest | Price snaps back inside the range | Broken level holds as support or resistance |
| Timing | Often early in a session | Can happen any time, often with news |
If price breaks a level and keeps going with strong closes, it is more likely a real breakout. If it breaks, stalls and snaps back, it is more likely an ICT Judas swing.
Common ICT Judas Swing Mistakes
- Trading without a bias: You cannot tell the fake move from the real one.
- Entering too early: Buying the first dip below the range often means catching a falling knife. Wait for confirmation.
- Calling every breakout a Judas swing: Many breakouts are genuine. Hindsight makes the pattern look more common than it is.
- Ignoring news: Major data releases can create moves that do not follow the usual session rhythm.
- Using stops that are too tight: Placing a stop just inside the sweep can get you taken out by a second spike.
- Overtrading: Not every day has a clear Judas swing. Some days trend from the open.
Limitations
The ICT Judas swing is a useful framework, but it is not a guaranteed signal. The pattern is easy to see in hindsight and harder to recognise in real time. There is also no peer-reviewed evidence that it reliably predicts price. Many experienced traders treat it as one piece of context, combined with market structure, key levels and strict risk management, rather than a standalone strategy.
Backtest the setup on the pairs and sessions you trade, record your results, and only trade it live once you have evidence that it works for you.
FAQs
What is the ICT Judas swing in simple terms?
It is a fake move at the start of a session that runs against the day’s real direction, takes out stop losses, then reverses.
When does the Judas swing usually happen?
Most often early in the London killzone, after the Asian range forms. It can also appear at the New York open.
Is the Judas swing the same as a stop hunt?
They are closely related. A Judas swing typically includes a stop hunt or liquidity sweep, followed by a reversal in the direction of the daily bias.
Can I use the Judas swing on any market?
Traders apply it to forex, indices, gold and crypto. It tends to work best in liquid markets with clear session opens.
How do I avoid being trapped by a Judas swing?
Have a daily bias, avoid chasing early breakouts against it, and wait for confirmation such as a market structure shift before entering.
Conclusion
The ICT Judas swing explains one of the most frustrating experiences in trading: being stopped out by a move that immediately reverses. By understanding where liquidity sits, when the fake move tends to happen and how to confirm it, you can stop being its victim and start trading the move that follows.
Start by marking the midnight open and the Asian range, set a clear daily bias, and wait patiently for the sweep and reversal. Combine the setup with sound risk management, test it thoroughly, and treat it as a tool for context rather than a guarantee.