Introduction
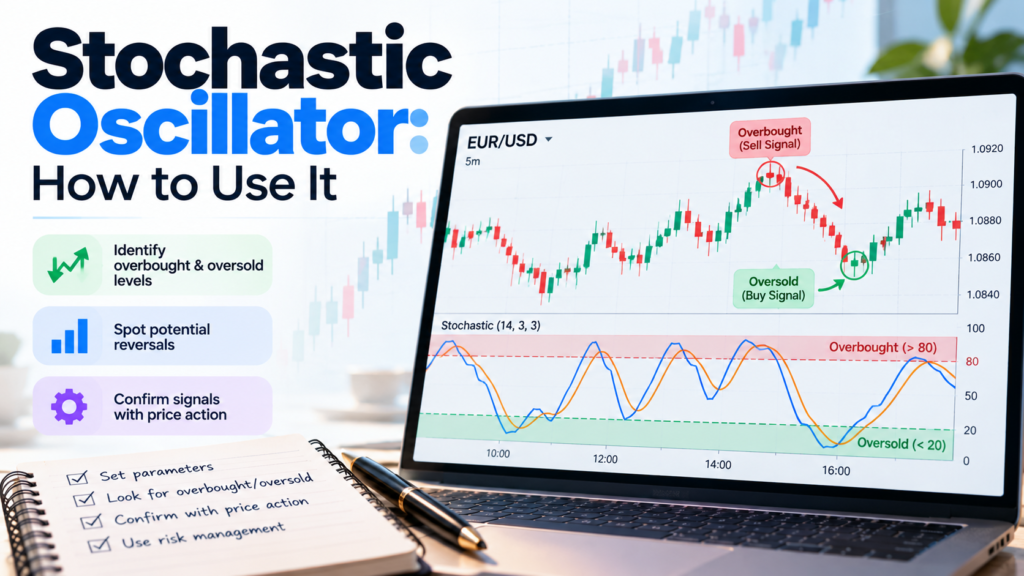
The stochastic oscillator is one of the most popular momentum indicators in technical analysis. Forex, stock and crypto traders use it to spot overbought and oversold conditions, time entries during pullbacks and catch early signs of a trend reversal.
It looks simple, just two lines moving between 0 and 100, but many traders use it the wrong way. They sell every time it goes above 80 and buy every time it drops below 20, then wonder why strong trends keep running over them.
This guide explains how to use the stochastic oscillator properly, covering:
- What it measures and how it is calculated
- Fast, slow and full stochastic settings
- The main signals: overbought and oversold, crossovers and divergence
- Three practical trading strategies, common mistakes and FAQs
What Is the Stochastic Oscillator?
The stochastic oscillator is a momentum indicator developed by George Lane in the 1950s. It compares a market’s closing price with its price range over a set period, usually 14 periods.
The idea behind it is simple. In an uptrend, prices tend to close near the top of their recent range. In a downtrend, they tend to close near the bottom. When closes start drifting away from the extremes, momentum may be fading, and that can come before a change in price direction.
Lane described it as measuring the speed, or momentum, of price rather than price itself. That is why traders use it as an early warning tool rather than a standalone buy or sell button.
How the Stochastic Oscillator Is Calculated
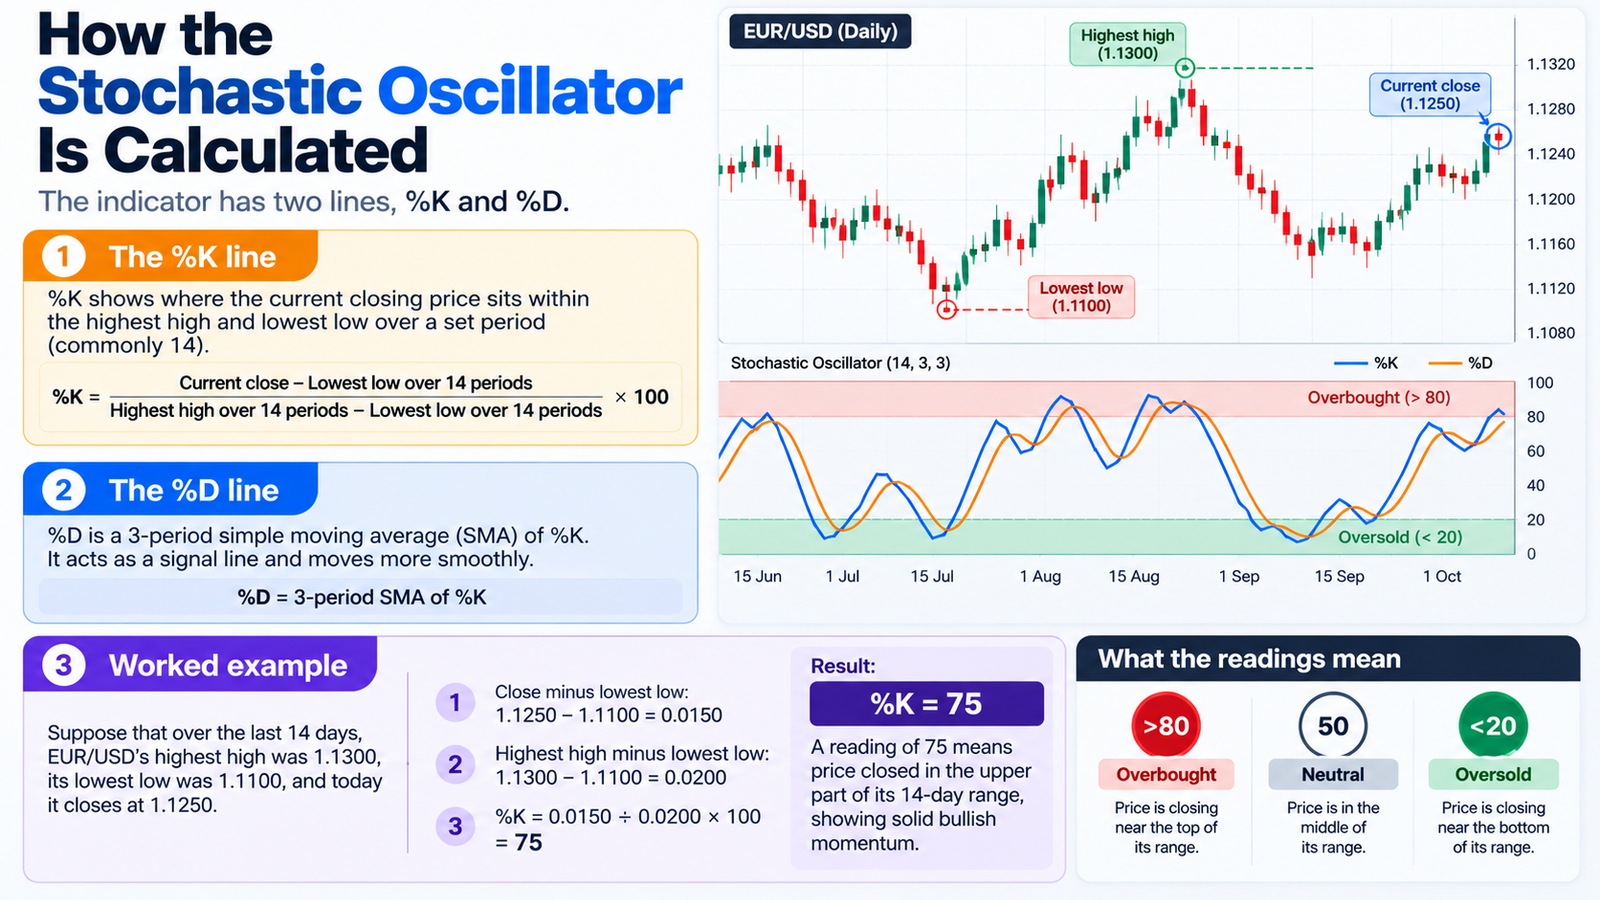
The indicator has two lines, %K and %D.
The %K line
%K = (Current close − Lowest low over 14 periods) ÷ (Highest high over 14 periods − Lowest low over 14 periods) × 100
The %D line
%D is a 3-period simple moving average of %K. It acts as a signal line and moves more smoothly.
Worked example
Suppose that over the last 14 days, EUR/USD’s highest high was 1.1300 and its lowest low was 1.1100. Today it closes at 1.1250.
- Close minus lowest low: 1.1250 − 1.1100 = 0.0150
- Highest high minus lowest low: 1.1300 − 1.1100 = 0.0200
- %K = 0.0150 ÷ 0.0200 × 100 = 75
A reading of 75 means price closed in the upper part of its 14-day range, showing solid bullish momentum.
| Reading | Meaning |
|---|---|
| Above 80 | Overbought: price is closing near the top of its range |
| 50 | Neutral: price is in the middle of its range |
| Below 20 | Oversold: price is closing near the bottom of its range |
 Fast, Slow and Full Stochastic
There are three common versions of the indicator, which differ in how much smoothing they apply:
| Version | How it works | Character |
|---|---|---|
| Fast stochastic | Raw %K, with %D as its 3-period average | Very sensitive, many signals, lots of noise |
| Slow stochastic | Fast %D becomes the new %K, smoothed again for a new %D | Smoother, fewer false signals |
| Full stochastic | Lets you choose the lookback and both smoothing periods | Most flexible; default is often 14, 3, 3 |
Most charting platforms use the slow or full version by default. For beginners, the slow stochastic with 14, 3, 3 settings is a good starting point because it filters out much of the noise.
Best Stochastic Settings
There is no single perfect setting. It depends on your trading style and timeframe:
| Style | Common settings | Notes |
|---|---|---|
| Standard | 14, 3, 3 | Balanced and widely used |
| Short-term or scalping | 5, 3, 3 | Faster signals, more noise |
| Swing or position trading | 21, 5, 5 | Slower, fewer but stronger signals |
Shorter settings make the indicator react faster but produce more false signals. Longer settings are smoother but react later. Test any setting on historical data before relying on it.
Key Stochastic Oscillator Signals
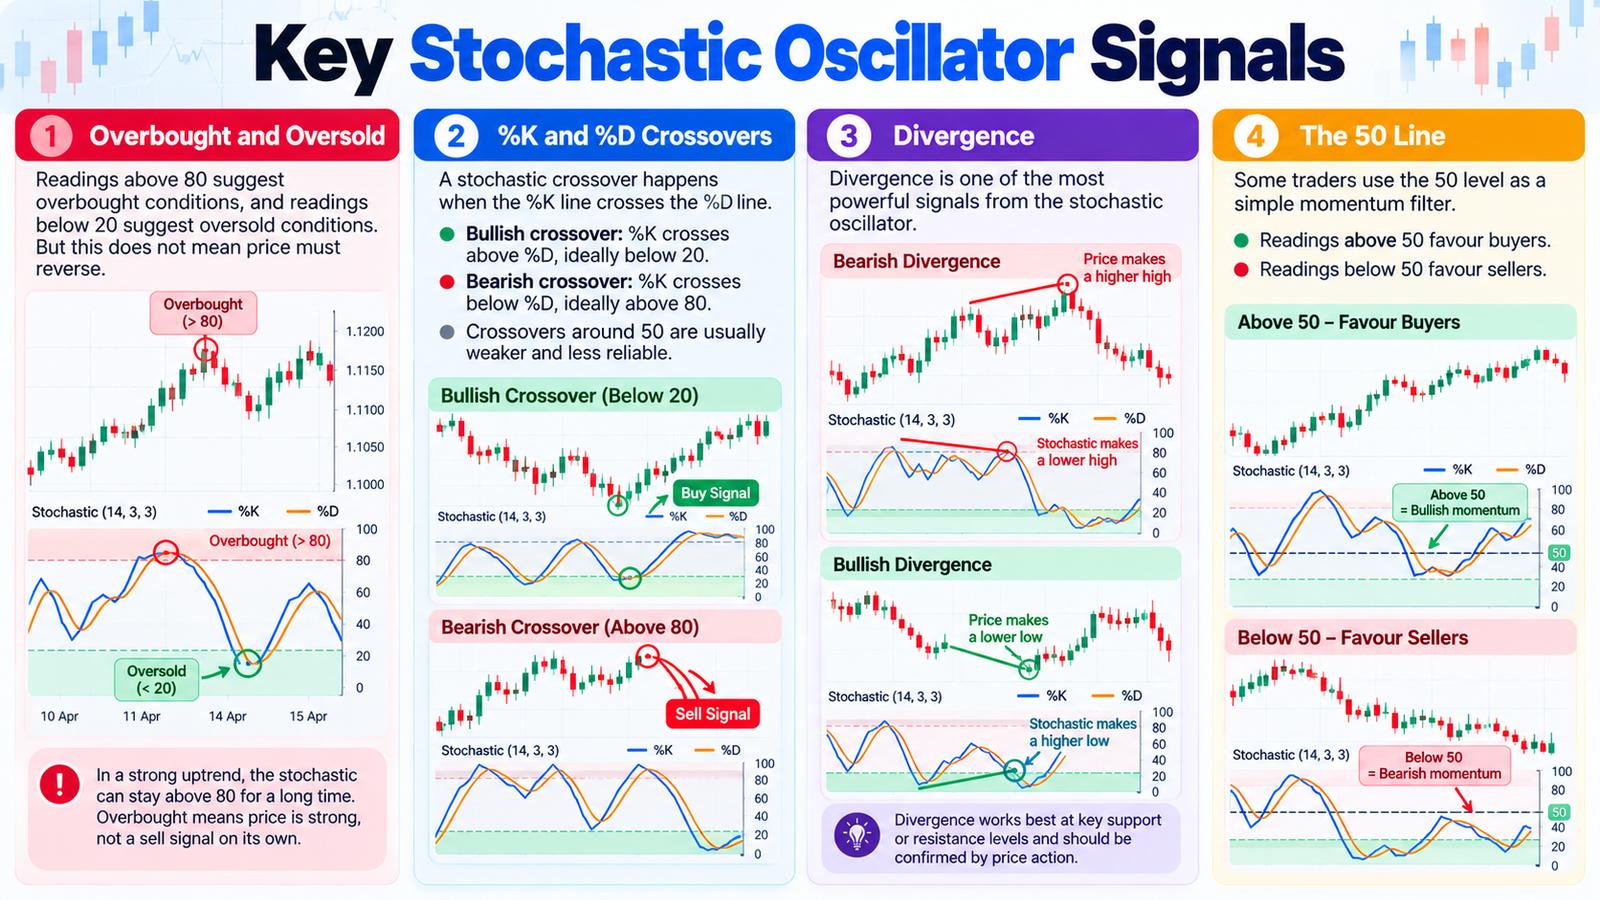
1. Overbought and oversold
Readings above 80 suggest overbought conditions, and readings below 20 suggest oversold conditions. But this does not mean price must reverse.
In a strong uptrend, the stochastic oscillator can stay above 80 for a long time. In a strong downtrend, it can stay below 20. Overbought simply means price is strong; it is not a sell signal on its own. Many traders wait for the indicator to move back below 80 or above 20 before acting.
2. %K and %D crossovers
A stochastic crossover happens when the %K line crosses the %D line:
- Bullish crossover: %K crosses above %D, ideally below 20.
- Bearish crossover: %K crosses below %D, ideally above 80.
Crossovers in the middle of the range, around 50, are usually weaker and less reliable.
3. Divergence
Divergence is one of the most powerful signals from the stochastic oscillator:
- Bullish divergence: Price makes a lower low, but the stochastic makes a higher low. Selling momentum is weakening.
- Bearish divergence: Price makes a higher high, but the stochastic makes a lower high. Buying momentum is fading.
Divergence works best at key support or resistance levels and should be confirmed by price action, such as a reversal candle or a break of a trendline.
4. The 50 line
Some traders use the 50 level as a simple momentum filter. Readings above 50 favour buyers, and readings below 50 favour sellers.
Three Stochastic Oscillator Trading Strategies
Strategy 1: Trend pullback
This is often the most reliable way to use the stochastic oscillator, because it trades with the trend rather than against it.
- Identify the trend using a 50-period or 200-period moving average. Price above it means uptrend.
- In an uptrend, wait for the stochastic to drop below 20 during a pullback.
- Enter long when %K crosses back above %D and moves above 20.
- Place the stop loss below the recent swing low.
- Target the previous high or a risk-reward ratio of at least 1:2.
In a downtrend, reverse the rules: wait for readings above 80 during a bounce, then sell on a bearish crossover.
Strategy 2: Range trading
When the market moves sideways, the stochastic oscillator works well for buying near support and selling near resistance.
- Identify a clear range with well-tested support and resistance.
- Buy near support when the stochastic is below 20 and gives a bullish crossover.
- Sell near resistance when it is above 80 and gives a bearish crossover.
- Place stops just outside the range.
- Exit if price breaks out of the range with strong momentum.
Range setups work best when the market has no clear trend, for example when moving averages are flat and price keeps bouncing between the same levels. As soon as a range breaks with a strong candle, switch back to the trend pullback approach instead of fading the move.
Strategy 3: Divergence at key levels
- Mark major support or resistance on a higher timeframe.
- When price reaches the level, look for bullish or bearish divergence on the stochastic.
- Wait for a confirming candle, such as an engulfing or pin bar.
- Enter in the direction of the divergence, with a stop beyond the recent extreme.
Example: Stochastic Oscillator on EUR/USD
Imagine EUR/USD is in an uptrend on the 4-hour chart, trading above its 50-period moving average. Price pulls back for a few sessions, and the stochastic drops to 15, well into oversold territory.
Price then forms a bullish candle at a previous support level, and %K crosses above %D, rising back above 20. A trader buys at that point, places a stop below the pullback low, and targets the previous swing high. The pullback setup works because it combines the trend, a support level and a stochastic signal.
This example is illustrative and does not refer to real prices.
Using the Stochastic on Different Timeframes
The same indicator behaves very differently depending on the chart you use. On a 5-minute or 15-minute chart, readings swing between overbought and oversold many times a day. That creates plenty of signals for day traders and scalpers, but also more false moves caused by random noise.
On the 4-hour and daily charts, signals are less frequent but tend to carry more weight. A daily stochastic reading below 20 inside a long-term uptrend, for example, often marks a meaningful pullback rather than a brief dip. Weekly readings are slower still and are mainly useful for spotting major turning points.
A practical approach is to use two timeframes together. Check the stochastic on a higher timeframe to see whether momentum is broadly rising or falling, then use a lower timeframe to time entries in that direction. When both point the same way, the signal is stronger. When they disagree, it is usually better to wait.
Combining the Stochastic with Other Tools
The stochastic oscillator works best as part of a system rather than on its own. Useful combinations include:
- Moving averages: Define the trend so you only take stochastic signals in its direction.
- Support and resistance: Signals at key levels are far more reliable than signals in the middle of nowhere.
- Candlestick patterns: Reversal candles confirm that buyers or sellers are stepping in.
- Multiple timeframes: Use the daily chart for trend and the 4-hour or 1-hour chart for stochastic entries.
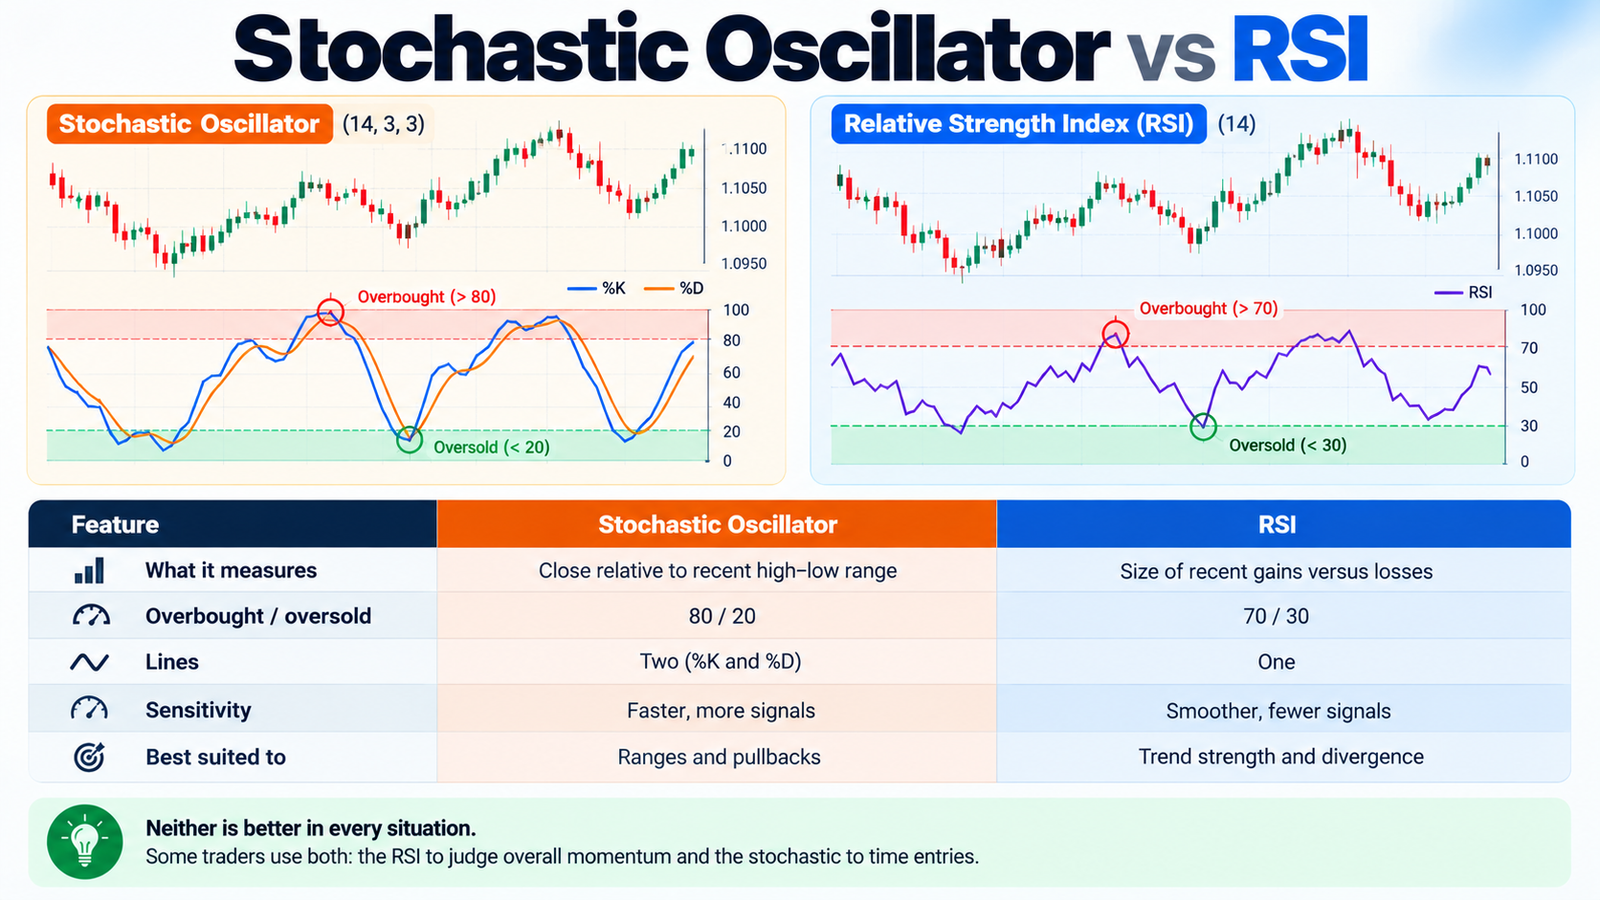
Stochastic Oscillator vs RSI
The Relative Strength Index (RSI) is the other popular momentum indicator, and traders often compare the two:
| Feature | Stochastic | RSI |
|---|---|---|
| What it measures | Close relative to recent high–low range | Size of recent gains versus losses |
| Overbought / oversold | 80 / 20 | 70 / 30 |
| Lines | Two (%K and %D) | One |
| Sensitivity | Faster, more signals | Smoother, fewer signals |
| Best suited to | Ranges and pullbacks | Trend strength and divergence |
Neither is better in every situation. Some traders use both: the RSI to judge overall momentum and the stochastic to time entries.
Common Mistakes
- Selling just because it is overbought: Strong trends can stay overbought for weeks.
- Trading against the trend: Counter-trend stochastic signals fail more often.
- Acting on every crossover: Crossovers near 50 are weak, and fast settings produce many false signals.
- Ignoring price action: The indicator should confirm what price is doing, not replace it.
- Over-optimising settings: Settings that fit past data perfectly often fail in live markets.
- Skipping risk management: Always use a stop loss and sensible position sizing.
Pros and Cons of the Stochastic Oscillator
Pros
- Easy to read, with clear 0–100 levels
- Works on any market and timeframe
- Helps time entries during pullbacks
- Divergence can give early warnings of reversals
Cons
- Produces many false signals in strong trends
- Can be noisy on short timeframes
- Works best with other tools, not on its own
FAQs
What is the best setting for the stochastic oscillator?
The standard 14, 3, 3 slow stochastic suits most traders. Scalpers may use 5, 3, 3, and swing traders sometimes use 21, 5, 5.
What do 80 and 20 mean on the stochastic?
Above 80 is considered overbought and below 20 oversold. They show where price is closing within its recent range, not guaranteed reversal points.
Is the stochastic oscillator good for day trading?
Yes, especially for timing entries during pullbacks, but faster settings increase noise, so combine it with trend and support and resistance.
What is the difference between %K and %D?
%K is the main line showing where price closed within its range. %D is a moving average of %K that acts as a signal line.
Can I use the stochastic oscillator for crypto and stocks?
Yes. It works on any liquid market and timeframe.
Conclusion
The stochastic oscillator is a simple but powerful momentum tool. It shows where price is closing relative to its recent range, helping you spot overbought and oversold conditions, crossovers and divergence.
The secret to using it well is context. Trade its signals in the direction of the trend, look for them at key support and resistance levels, confirm them with price action, and always manage your risk. Practise on a demo account first, and the stochastic oscillator can become a reliable part of your trading toolkit.
Disclaimer: This article is for education only and is not investment or trading advice. Trading involves a high risk of loss. Practise on a demo account and consult a registered financial adviser before trading.