

Introduction
Bitcoin is stuck in the low $80,000s. BTC/USD outlook traded around $82,450 on Wednesday, inside a tight range between roughly $80,500 and $84,000. That is about a third below its all-time high near $126,000, set in October 2025, but well above its 2026 low near 58,000–60,000.
This week brought one encouraging signal. On Monday, 19 October, US spot Bitcoin ETFs took in about $527 million, the strongest daily inflow since September, led by BlackRock’s IBIT. Yet momentum indicators remain neutral, and the Fed meets next week with markets still worried about higher US rates.
In this BTC USD outlook, we cover:
- Where Bitcoin stands now and how it got here
- Key Bitcoin support and resistance levels
- Moving averages, RSI and market sentiment
- ETF flows, macro drivers, events to watch and three scenarios
Where Bitcoin Stands Now
| Indicator | Level | What it signals |
|---|---|---|
| BTC price today (21 Oct) | ~$82,450 | Mid-range, just below short-term resistance |
| Intraday range (21 Oct) | $81,185 – $82,954 | Narrow trading, low conviction |
| Bitcoin all-time high | ~$126,000 (6 Oct 2025) | Price is roughly 34–35% below the peak |
| 2026 low | ~58,000–60,000 (late June / early July) | Price has rebounded about 40% from the low |
| 14-day RSI | ~46–48 | Neutral, just below the 50 midline |
| Fear and Greed Index | 50 (Neutral) | Down from 53 a week earlier |
For Indian readers, Bitcoin price in INR is roughly ₹78 lakh at a dollar rate near ₹95. Local exchange prices can differ slightly because of fees and local demand.
The picture is one of balance. Bitcoin has recovered strongly from its summer low, but it has failed to push through the mid-$80,000s for several weeks. That tension shapes this week’s BTC USD outlook.
How Bitcoin Got Here
After peaking near $126,000 in October 2025, Bitcoin fell sharply. Macro worries and a tariff-related liquidation event pushed it down to around 58,000–60,000 by mid-2026. From there it rallied about 45% into late September, helped by steady spot ETF inflows.
October has been choppier. Bitcoin traded near $85,300 on 6 October, one year after its record, but slipped as ETF flows turned negative. Spot Bitcoin ETFs saw net outflows of about $681 million in the week to 9 October and another $229 million in the week to 16 October, with the largest single-day outflow of about $261 million on 14 October.
History shows that a 30%-plus drawdown after a peak is normal for Bitcoin. Past recoveries from drawdowns of that size have taken roughly 28 to 38 months, which is useful context for any longer-term BTC USD outlook.

BTC USD Outlook: Support and Resistance Levels
These are the Bitcoin support and resistance levels most often cited by analysts this week:
| Type | Level | Why it matters |
|---|---|---|
| Major resistance | $89,000 – $92,000 | Upper targets if the range breaks higher |
| Resistance | $86,600 – $87,300 | Prior twin top and swing resistance |
| Key resistance | $84,000 – $84,122 | Range ceiling and a large liquidation cluster |
| Near resistance | $82,281 – $82,580 | Breakout shelf and 20-day EMA |
| Near support | $80,477 – $80,567 | 50-day EMA |
| Support | $79,694 | Recent swing low |
| Support | $78,000 – $78,500 | Intermediate support zone |
| Key support | $76,964 | 100-day EMA |
| Major support | $75,869 | 200-day EMA; losing it would end the advance |
The two levels that matter most in this BTC USD outlook are $84,000 on the upside and $80,500 on the downside. A daily close outside that band would likely set the direction for the rest of the week.
Bitcoin Technical Analysis: Indicators
Moving averages
Bitcoin’s moving averages tell a mixed but mostly constructive story. Price sits just below the 20-day EMA near $82,560, which shows short-term weakness. But it remains above the 50-day EMA near $80,500, the 100-day EMA near $77,000 and the 200-day EMA near $75,900.
When the longer averages stay below price and keep rising, the medium-term trend is still up. As long as Bitcoin holds above the 200-day EMA, the broader BTC USD outlook stays in recovery mode.
RSI and momentum
The 14-day RSI is hovering around 46–48, just under the 50 midline and below its signal line. That points to neutral momentum: neither buyers nor sellers are in control. A move back above 50, together with a break of $84,000, would be a stronger bullish signal.
Market sentiment
The crypto Fear and Greed Index sits at 50, firmly neutral. Neutral sentiment often comes before a larger move, because traders are not yet crowded on one side. On-chain data shows long-term holder supply easing slightly, from about 16.8 million BTC in mid-2026 to about 16.4 million, which suggests some long-term investors have been taking profits into the rebound.

Spot Bitcoin ETF Flows
ETF flows are one of the biggest drivers of the BTC USD outlook this year. Here is how they have moved in October:
| Period | Net flow (US spot Bitcoin ETFs) |
|---|---|
| Week to 9 Oct | About −$681 million |
| Week to 16 Oct | About −$229 million |
| Mon 19 Oct | About +527million(IBITabout+663 million) |
| October to date (to 19 Oct) | About −$91 million |
Monday’s inflow narrowed the month’s losses but did not erase them. Total spot ETF assets stand at about $104 billion, with cumulative inflows of about $56.9 billion since launch. If inflows continue for several days, they could provide the fuel for a break above $84,000.
Not all demand data is upbeat. CryptoQuant’s apparent demand measure has stayed negative and has weakened since May. Analysts at Brave New Coin say the recovery “remains unconfirmed” until ETF inflows prove sustained and price breaks nearby resistance.
Macro Drivers for the BTC USD Outlook
US inflation and the Fed
US inflation rose to 3.7% in September, above forecasts, and core inflation climbed to 2.6%. That briefly pushed the odds of an October Fed rate hike above 50%. After comments from Fed Chair Kevin Warsh, those odds fell to around 15%, but markets still see a December hike as likely. The Fed meets on 27–28 October.
Bond yields and the dollar
The US 10-year Treasury yield is above 5%. High yields make holding non-yielding assets like Bitcoin less attractive and tend to strengthen the dollar. Any drop in yields would ease pressure on crypto and improve the BTC USD outlook.
Risk appetite
Bitcoin often trades in step with technology stocks. Big tech earnings this week and next, and the mood in equity markets, can spill over into crypto.
What the Wider Crypto Market Is Saying
Bitcoin has held up better than the rest of the crypto market. Over the week to 19 October, Bitcoin slipped about 1.4% to roughly $82,600, while Ethereum fell about 4.7% to around $2,426 and Solana dropped about 5.9% to near $105. Ethereum also trades below its 20-day and 50-day EMAs.
When altcoins fall faster than Bitcoin, it usually signals a cautious, defensive market in which investors prefer the largest and most liquid coin. For the BTC USD outlook, that is a mixed sign: Bitcoin is the relative winner, but the broader crypto market outlook is not yet showing the risk appetite that typically drives strong rallies.
Key Events to Watch
| Date | Event | Why it matters for BTC/USD |
|---|---|---|
| Daily | Spot Bitcoin ETF flows | The clearest read on institutional demand |
| Thu 22 Oct | US weekly jobless claims | Shapes Fed hike expectations |
| Fri 23 Oct | US flash PMIs | Early read on October growth and risk mood |
| 27–28 Oct | Fed decision | A hawkish surprise could pressure Bitcoin |
| Ongoing | Tech earnings, Treasury yields | Drive broader risk appetite |
Because crypto trades over the weekend, Bitcoin can react to news before traditional markets open on Monday. Keep that in mind when planning around these events.
BTC USD Outlook: Three Scenarios
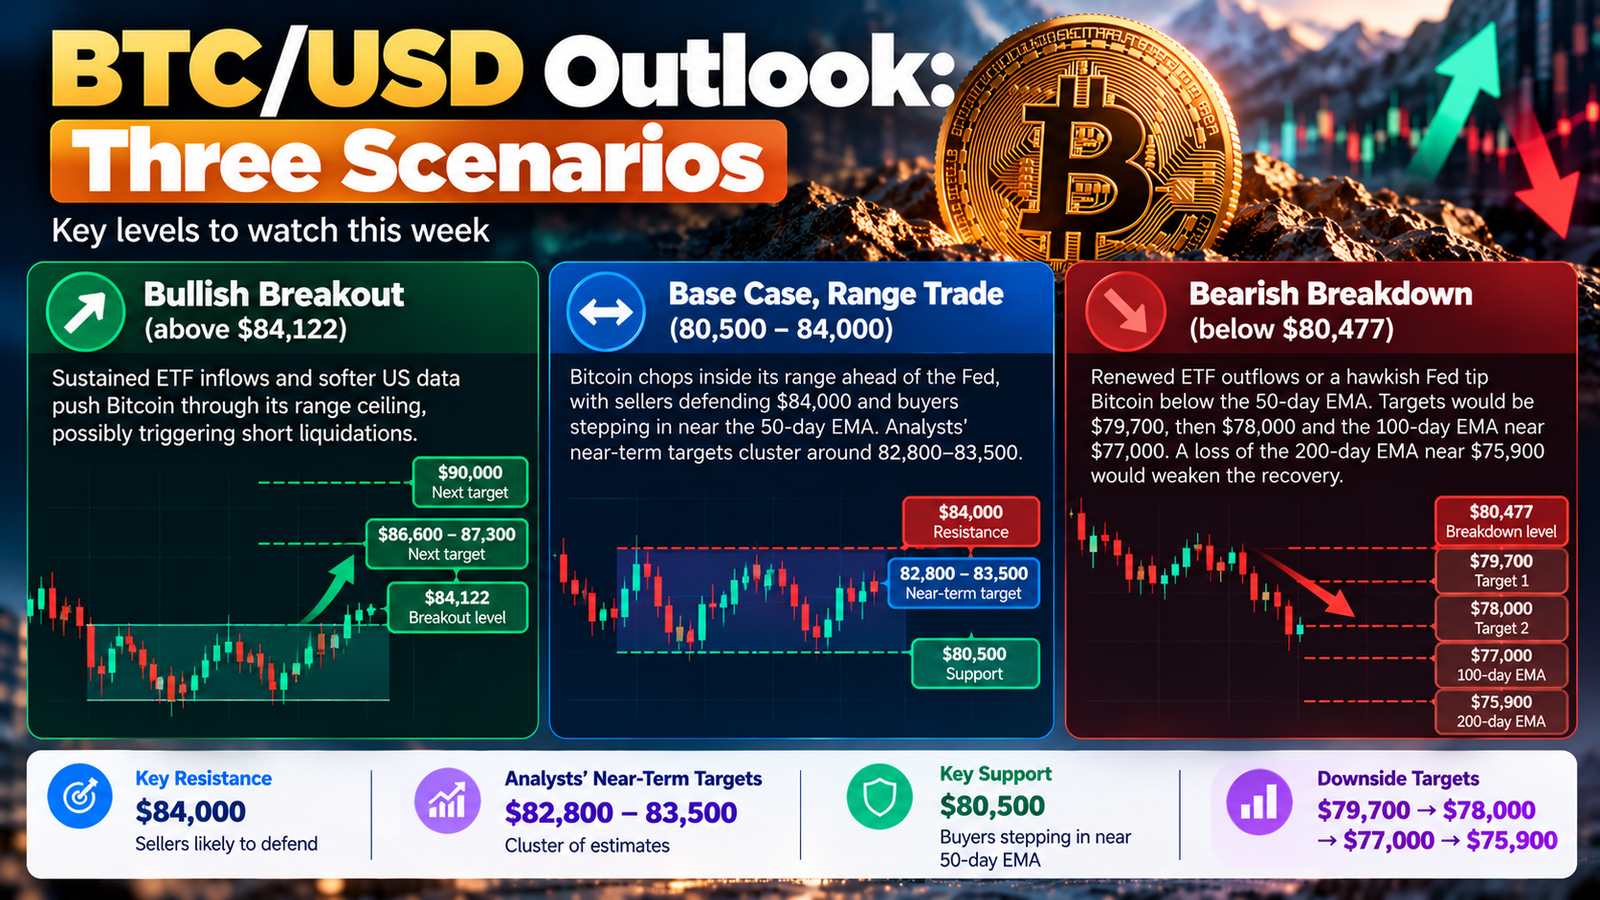
- Base case, range trade (80,500–84,000): Bitcoin chops inside its range ahead of the Fed, with sellers defending $84,000 and buyers stepping in near the 50-day EMA. Analysts’ near-term targets cluster around 82,800–83,500. This is our central BTC USD outlook for the week.
- Bullish breakout (above $84,122): Sustained ETF inflows and softer US data push Bitcoin through its range ceiling, possibly triggering short liquidations. Targets would be 86,600–87,300, then $89,000 and the $90,000 area.
- Bearish breakdown (below $80,477): Renewed ETF outflows or a hawkish Fed tip Bitcoin below the 50-day EMA. Targets would be $79,700, then $78,000 and the 100-day EMA near $77,000. A loss of the 200-day EMA near $75,900 would weaken the recovery.
Bitcoin Price Prediction: Longer-Term View
Looking further ahead, forecasts are cautious but generally positive. CoinDCX’s analysis puts a base case around $83,500 for October, about $87,000 for November within a 78,000–92,000 range, and around $90,000 for December. Those are projections, not guarantees, and they depend heavily on ETF demand and Fed policy.
The bigger question is whether the summer low near 58,000–60,000 marked the bottom of this cycle. Some analysts compare the current consolidation to the 2022–2023 accumulation phase, but history does not always repeat. A longer-term BTC USD outlook should allow for both a gradual recovery and another leg lower.
How to Use This BTC USD Outlook
- Range traders: Consider selling near 83,500–84,000 and buying near 80,500–81,000, with stops beyond the range.
- Breakout traders: Wait for a daily close above $84,122 or below $80,477 to avoid false breaks.
- Long-term investors: Spread purchases over time rather than trying to time the bottom, and size positions for Bitcoin’s high volatility.
- Everyone: Reduce leverage around the Fed meeting, when liquidations can amplify moves in both directions.
Indian readers should also remember that crypto gains are taxed at 30% in India, with 1% TDS on transfers, which affects net returns from short-term trading.
Risk Management Checklist
Bitcoin can move 5% or more in a single day, so a plan matters more than a precise forecast. Before acting on any BTC USD outlook, run through these questions:
- Where is my stop? Place it beyond a clear level, such as below $80,000 for a long trade from the range low.
- How much am I risking? Many traders limit risk to 1–2% of their account on a single trade.
- Am I using too much leverage? High leverage near a range edge is a common cause of liquidations.
- What news is coming? Avoid opening large positions just before the Fed decision or big data releases.
- What would prove me wrong? Write down the level or event that would change your view.
A disciplined approach lets you benefit when the BTC USD outlook plays out and limits the damage when it doesn’t. Treat this BTC USD outlook as a map of levels and risks, not a promise.

FAQs
What is the BTC USD outlook for this week?
Our base case is a range of about 80,500–84,000 ahead of the Fed meeting, with a break of either level likely to set the next direction.
What are the key Bitcoin support levels?
$80,477 (50-day EMA), $79,694, $78,000, $76,964 (100-day EMA) and $75,869 (200-day EMA).
What are the key Bitcoin resistance levels?
$82,580 (20-day EMA), 84,000–84,122, 86,600–87,300, then 89,000–92,000.
How far is Bitcoin from its all-time high?
About 34–35% below its record near $126,000 set on 6 October 2025.
What could change the BTC USD outlook quickly?
A run of strong ETF inflows, a hawkish Fed surprise, or a sharp move in US bond yields.
Conclusion
Bitcoin enters the second half of the week balanced between hope and caution. A big ETF inflow on Monday and a price holding above the 50-day EMA give bulls something to work with. But neutral momentum, weak demand data and a looming Fed decision keep the upside in check.
Watch $84,000 and $80,500 as the key line in the sand, track daily ETF flows, and prepare for volatility around the 27–28 October Fed meeting. We will update our BTC USD outlook next week with fresh levels.