

Key points on Gold Price Outlook
- Spot gold traded near $4,114–4,117 on Wednesday, 21 October, on course for a fourth straight daily loss.
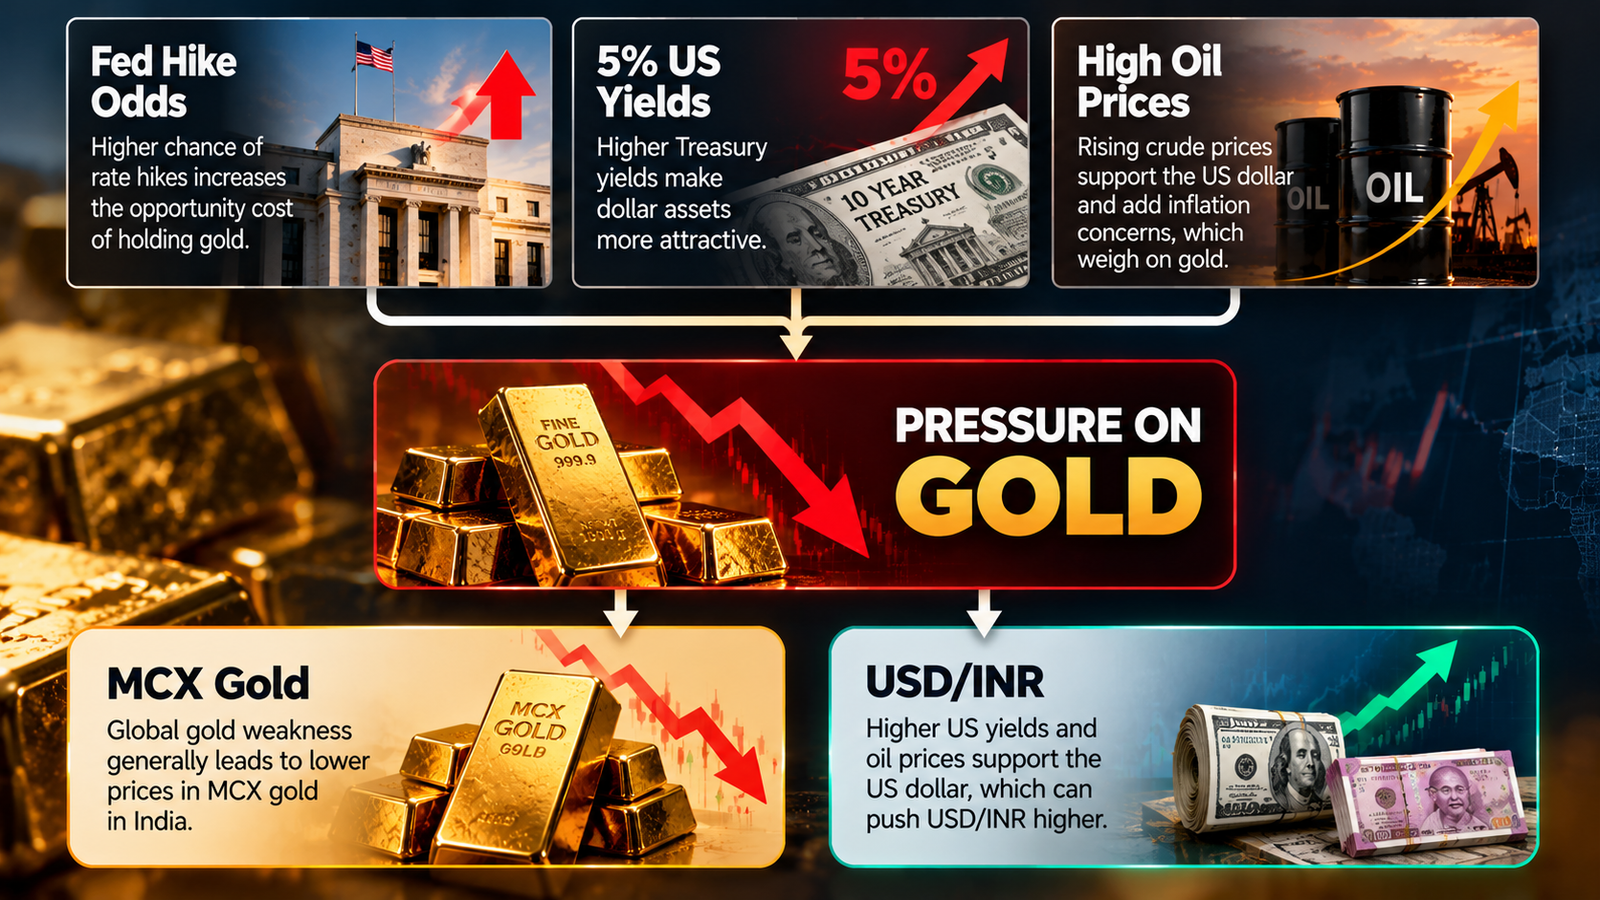
- Markets price a 92–94% chance of a Fed rate hike in December, and the US 10-year yield is above 5.1%, which weighs on non-yielding gold.
- Gold is down about 5% over the past month and well below its January 2026 record above $5,600.
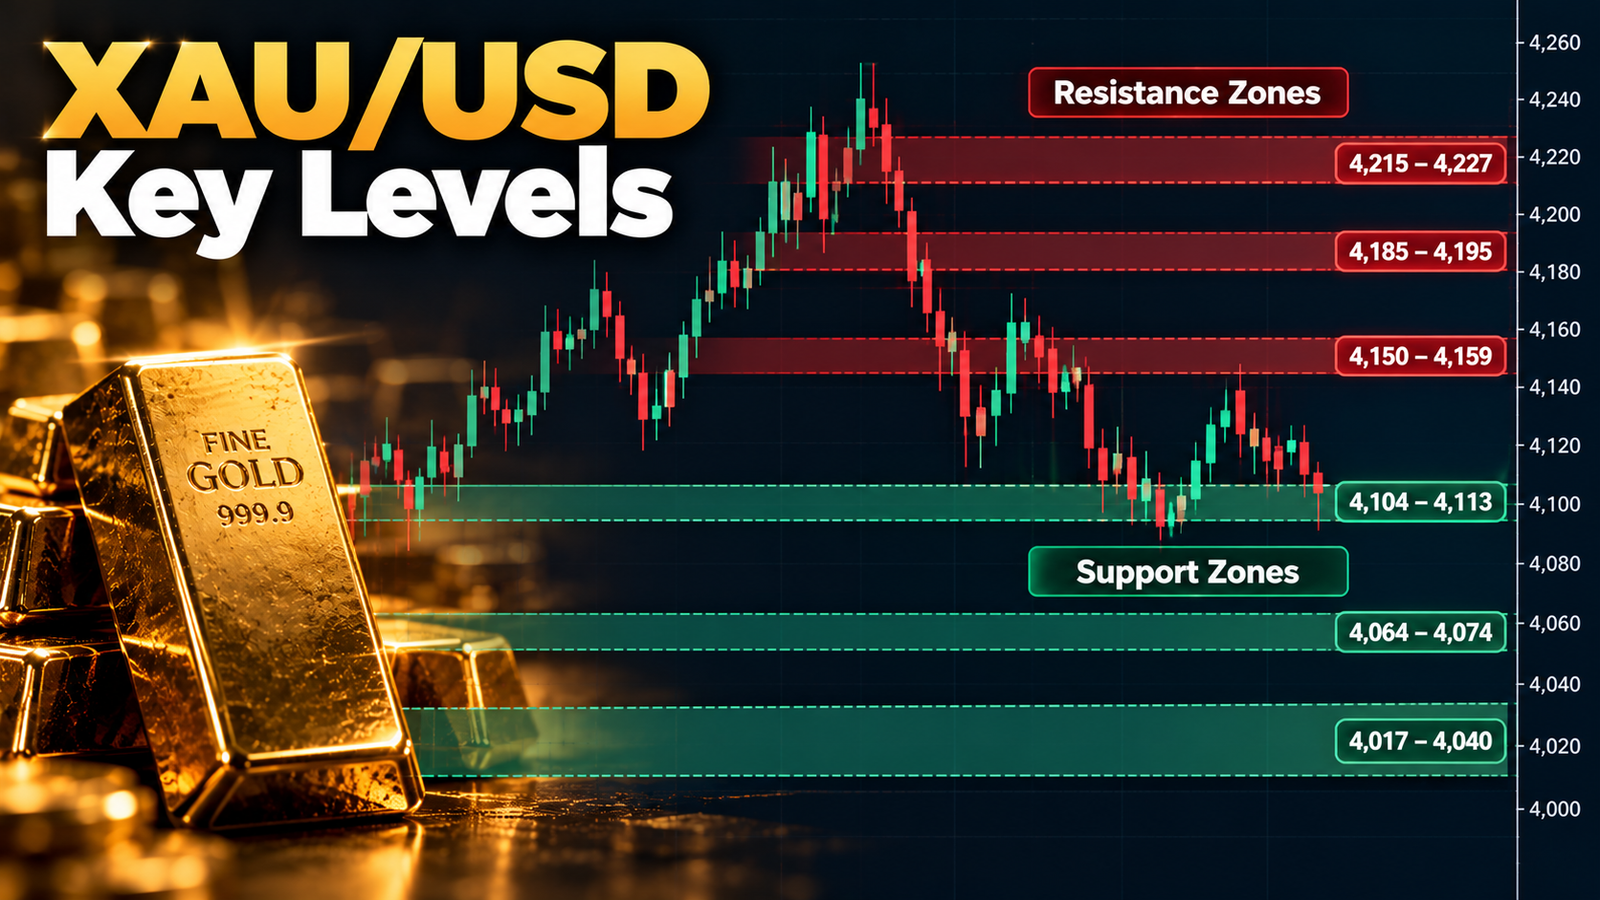
- Key zone this week: support at $4,104–4,113, resistance at $4,150–4,159. The FOMC on 28 October (late evening IST) is the next big test.
What happened
Gold has slipped steadily since last Friday. On Monday, 19 October, XAU/USD touched a high near $4,190 before closing about 0.8% lower at $4,132. It eased again on Tuesday to $4,126, with an intraday low around $4,112.
On Wednesday morning, Kitco quoted spot gold at $4,117.20 at 2:16 a.m. New York time (11:46 IST), down $6.90 on the day. In the European morning (around 12:55 IST), the price was near $4,114, down roughly 0.2%.
| Date | Close (US$/oz) | Day high | Day low | Change |
|---|---|---|---|---|
| Fri, 16 Oct | 4,165.50 | 4,198.84 | 4,147.26 | −0.13% |
| Mon, 19 Oct | 4,132.38 | 4,190.57 | 4,132.26 | −0.80% |
| Tue, 20 Oct | 4,126.53 | 4,147.08 | 4,111.71 | −0.14% |
| Wed, 21 Oct (intraday, ~11:46 IST) | ~4,117 | 4,132.90 | 4,105.40 | −0.17% |
Over the past 30 sessions, gold ranged between about $4,066 and $4,388, and it is down around 5.3% on the month. The all-time high of roughly $5,608 was set in January 2026.
Why it matters
Interest rates are the main headwind. Hot September CPI and PPI data have kept traders expecting a Fed hike in December, even if the Fed holds in October. Higher rates raise the cost of holding gold, which pays no interest. The US 10-year Treasury yield eased only slightly to about 5.12%.
Oil feeds the inflation story. Brent crude jumped above $111 before easing on reports of diplomatic talks over the Strait of Hormuz. Higher oil means higher inflation risk, and that supports the case for tighter Fed policy.
Weak US data hasn’t helped. September housing starts fell 5.2% to 1.221 million units, below the 1.305 million expected. In a normal cycle, weak data would support gold through rate-cut hopes. This time, sticky inflation means markets still see the Fed hiking rather than cutting.
Longer-term demand is still discussed. The World Gold Council, with Boston Consulting Group, said tokenised gold could unlock up to $700 billion of new investment demand. This is a structural theme, not a driver for this week’s price.
Key levels to watch this week
Gold has traded in a range for more than two weeks, roughly between $4,070–4,105 at the bottom and $4,200–4,235 at the top. On the short-term chart, price is below its moving averages and testing first support. The levels below are from Mitrade’s technical analysis for 21 October.
| Level | Zone (US$/oz) | What it means |
|---|---|---|
| Resistance 3 | 4,215–4,227 | Near the top of the recent range |
| Resistance 2 | 4,185–4,195 | Monday’s rejection area |
| Resistance 1 | 4,150–4,159 | First barrier for any rebound |
| Support 1 | 4,104–4,113 | Being tested now; buyers stepped in here last week |
| Support 2 | 4,064–4,074 | Near the 30-day low |
| Support 3 | 4,017–4,040 | Major support zone |
Possible scenarios:
- If gold holds above $4,104–4,113 and breaks through $4,150–4,159, a recovery toward $4,185–4,195 is likely to come into focus.
- If gold breaks below $4,104, the next downside zones are $4,064–4,074 and then $4,017–4,040.
- If neither side breaks, gold may stay range-bound between $4,104 and $4,159 until the FOMC.
To size positions around these levels, use our XAU/USD Pip Calculator to see what each $1 move is worth for your lot size.
Impact on Indian traders
MCX gold: Domestic gold prices follow international XAU/USD, converted at USD/INR and adjusted for import duty and premiums. A weaker XAU/USD lowers MCX gold, but a weaker rupee can offset part of that fall. MCX gold level this week
USD/INR: The same forces pressuring gold, a firm dollar (DXY near 102), US yields above 5% and high crude, are also headwinds for the rupee. India is a large oil importer, so a rise in Brent tends to add pressure on USD/INR. USD/INR level this week
NSE currency pairs: XAU/USD is not traded on NSE’s currency segment. Indian traders can use USD/INR, EUR/INR, GBP/INR and JPY/INR, plus EUR/USD, GBP/USD and USD/JPY. The Fed outlook driving gold is also the key driver for these dollar pairs. Trading forex or gold CFDs with unauthorised offshore platforms is not permitted under FEMA.
What to watch next
| Date (IST) | Event | Why it matters for gold |
|---|---|---|
| Wed, 21 Oct (evening) | US 20-year Treasury auction; weekly crude inventories [VERIFY times] | Weak demand at the auction could push yields higher |
| Thu, 22 Oct, 18:00 | US initial jobless claims [VERIFY] | Labour data shapes Fed hike odds |
| Fri, 23 Oct | US S&P Global flash PMIs [VERIFY date and time] | An early read on October activity |
| Wed, 28 Oct, ~23:30 | FOMC decision (rate at 3.75–4.00%) | A hawkish signal for December could pressure gold further |
Also watch headlines on the Strait of Hormuz and oil prices, which have been moving inflation expectations day to day. Track all release times on our Economic Calendar, and find more coverage in Market Analysis & News.
FAQs
Why is gold falling this week?
Markets expect the Fed to raise rates in December, and US 10-year yields are above 5%. That makes interest-paying assets more attractive than gold. High oil prices also keep inflation and rate-hike fears alive.
What are the key gold price levels this week?
Support is at $4,104–4,113, then $4,064–4,074. Resistance is at $4,150–4,159, then $4,185–4,195.
How does XAU/USD affect MCX gold prices in India?
MCX gold is priced off international gold converted into rupees. A fall in XAU/USD usually lowers MCX gold, but a weaker rupee can soften that decline.
This article is for information and education only and is not investment advice.