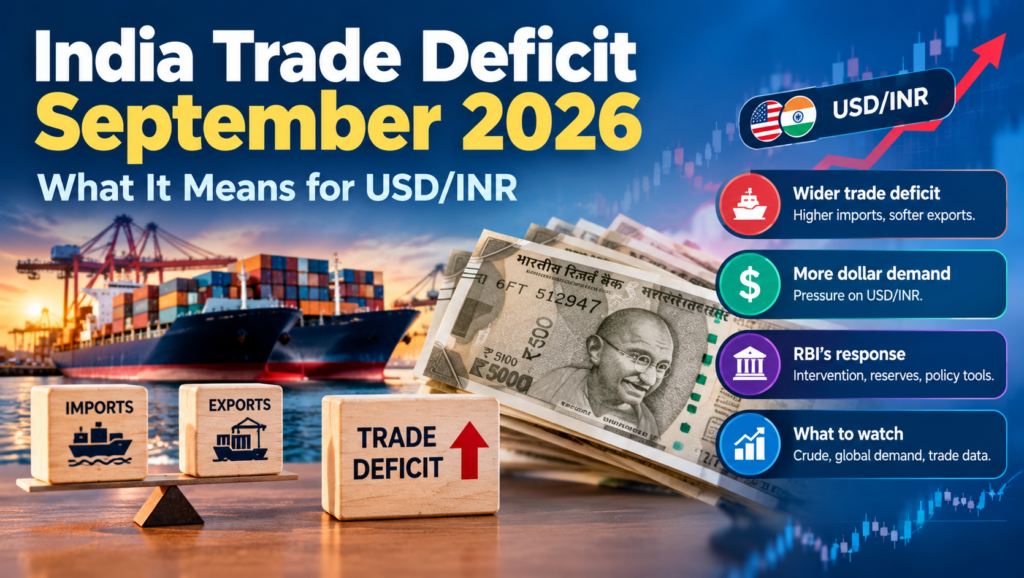
India’s merchandise trade deficit widened to USD 30.21 billion in September 2026, up from USD 26.86 billion in August. Exports grew strongly, rising 23% from a year earlier, but imports grew too, led by petroleum and electronics. With Brent crude above USD 100 a barrel and the rupee near 95 per dollar, the trade figures matter directly for USD/INR.
This article explains the September trade data, what drove exports and imports, how the trade deficit links to India’s current account and the rupee, and what traders and importers should watch next.
India Trade Deficit September 2026 at a Glance
According to Ministry of Commerce data released on 15 October 2026, India’s merchandise exports were USD 44.40 billion in September 2026 and imports were USD 74.61 billion, leaving a goods trade deficit of USD 30.21 billion. The deficit was wider than August’s USD 26.86 billion but narrower than USD 33 billion a year earlier, and slightly below the USD 30.4 billion forecast in a Reuters poll.
| Measure (USD billion) | September 2026 | August 2026 | September 2025 |
|---|---|---|---|
| Merchandise exports | 44.40 | 43.81 | 36.08 |
| Merchandise imports | 74.61 | 70.67 | About 69 |
| Merchandise trade deficit | 30.21 | 26.86 | About 33.0 |
| Services exports (estimate) | 36.35 | n/a | 36.67 |
| Overall trade deficit (goods and services) | 13.30 | n/a | 14.17 |
Sources: Ministry of Commerce data as reported by Business Today, Business Recorder (Reuters) and The Policy Edge. The September 2025 import figure is derived from the reported deficit and exports. September services figures are estimates.
Wider or Narrower?
Headlines described the same data in opposite ways. Compared with August, the deficit widened by about USD 3.35 billion because imports rose faster than exports. Compared with September 2025, it narrowed by about USD 2.79 billion because exports grew 23% while imports grew about 8%. Both readings are correct. For the rupee, the month-on-month increase and the six-month trend matter more, because they show how much dollar demand is building.
What Drove Exports
Export growth was broad. Commerce Secretary Rajesh Agrawal said exports were “maintaining their growth momentum” and that growth was “widespread.” According to a summary of the official data by ChartForest:
- Engineering goods, the largest category, rose 20.91% to USD 12.17 billion.
- Petroleum product exports rose 31.90% to USD 6.22 billion, helped by higher global fuel prices.
- Electronic goods exports rose 70.44% to USD 5.31 billion.
- Organic and inorganic chemicals rose 24.21% to USD 2.94 billion.
Non-petroleum exports rose to USD 38.18 billion from USD 31.37 billion a year earlier, showing that the gains were not only a price effect from oil. The United States remained India’s largest export market, with shipments of USD 50.81 billion in April to September. Trade talks with the US are continuing, and a broader agreement with the European Union is moving toward implementation.
What Drove Imports
Petroleum
Imports of crude oil and petroleum products rose 30.76% to USD 18.34 billion in September, from USD 14.03 billion a year earlier. Oil was the single largest import category and the main reason the bill rose. Brent crude has stayed above USD 100 a barrel because of the conflict involving Iran and disruption to shipping, and the Indian crude basket averaged about USD 116 a barrel in September, according to figures cited in coverage of the RBI’s October policy meeting.
Electronics
Electronic goods imports rose 51.49% to USD 14.86 billion. Part of this reflects components for India’s expanding electronics manufacturing, which also explains the strong growth in electronics exports.
Gold
Gold imports fell sharply, to USD 1.80 billion in September from USD 9.61 billion a year earlier, a drop of 81%. Over April to September, gold imports fell 27.32% to USD 19.27 billion. Very high international gold prices, near USD 4,100 to USD 4,200 an ounce in mid-October, have reduced demand. Without the fall in gold, the September deficit would have been several billion dollars wider.
The First Half of FY27: A Wider Gap
The six-month picture is less favourable than September’s annual comparison. For April to September 2026:
| Measure (USD billion) | April to September 2026 | Change from a year earlier |
|---|---|---|
| Merchandise exports | 259.89 | Up 18.51% |
| Merchandise imports | 437.53 | Up 16.31% |
| Merchandise trade deficit | 177.64 | n/a |
| Services surplus | 102.71 | n/a |
| Overall trade deficit (goods and services) | 74.93 | Wider than 58.10 |
Source: Ministry of Commerce data as reported by Business Today and The Policy Edge.
Because imports are about 1.7 times exports, even similar percentage growth rates widen the gap in dollar terms. The combined goods and services deficit for the half-year was about USD 17 billion larger than a year earlier.
From Trade Deficit to Current Account
The merchandise trade deficit is only one part of India’s balance of payments. The current account also includes services trade, remittances from Indians working abroad and investment income. India runs a large surplus on services and remittances, which covers most of the goods deficit.
RBI data for April to June 2026, the latest available quarter, show how this works:
| Item (USD billion) | April to June 2026 | April to June 2025 |
|---|---|---|
| Merchandise trade deficit | 86.1 | 68.9 |
| Net services receipts | 51.6 | 47.9 |
| Remittances (personal transfers) | 42.9 | 33.2 |
| Current account deficit | 4.2 (0.5% of GDP) | 3.4 (0.4% of GDP) |
| Net foreign portfolio investment | Outflow of 9.6 | Inflow of 1.6 |
| Change in reserves (BoP basis) | Fall of 8.1 | Rise of 4.5 |
Source: RBI balance of payments data as reported by The Tribune (ANI), September 2026.
The current account deficit was small at 0.5% of GDP. The bigger problem was the capital account: foreign portfolio investors withdrew USD 9.6 billion, and reserves fell. In other words, the trade deficit adds steady pressure on the rupee, but foreign capital outflows have turned that pressure into a funding gap that the RBI has had to fill.
How the Trade Deficit Affects USD/INR
Dollar Demand From Importers
Every dollar of imports has to be paid for, usually by buying dollars with rupees. A USD 30 billion monthly goods deficit means importers need about USD 30 billion more than exporters bring in, before services and remittances are counted.
Hypothetical example: at ₹95 per dollar, the September goods deficit of USD 30.21 billion is worth about ₹2.87 lakh crore. If oil prices rose a further 10% and import volumes stayed the same, the petroleum bill of USD 18.34 billion would rise by about USD 1.83 billion a month, or roughly ₹17,400 crore at the same exchange rate. That additional dollar demand would come mainly from oil companies, which tend to buy dollars in large amounts.
The Oil and Rupee Loop
A weaker rupee raises the rupee cost of imports, and higher import costs widen the deficit and increase dollar demand. This loop is visible in India’s inflation data: wholesale inflation rose to 11.39% in September, with fuel and power up 25.85%. Breaking the loop usually needs lower oil prices, stronger capital inflows or central bank intervention.
RBI Intervention
The RBI has acted on several fronts. It routed part of oil companies’ dollar demand through a special facility, tightened rules on hedging and imposed cash-margin requirements on certain importer and bank hedges, according to Reuters reports. It also sold dollars directly and raised the repo rate by 25 basis points to 5.50% on 7 October. India’s foreign exchange reserves fell by USD 12.95 billion to USD 734.61 billion in the week ended 2 October, a decline that reflects intervention as well as valuation changes.
How the Rupee Reacted
The trade data was largely in line with forecasts, so the rupee’s moves this week were driven more by the global dollar and RBI action. The rupee closed at 94.99 per dollar on 15 October, the day the trade data was released, and opened stronger at 94.75 on 16 October as the dollar fell after US data, according to PTI. Traders said high crude prices and foreign equity outflows of about ₹5,285 crore on 15 October limited the rupee’s gains.
The rupee crossed 95 per dollar for the first time on 30 April 2026 and reached a reported record low of 96.25 on 18 May. Its recovery since then has depended heavily on the RBI.
What Traders and Importers Should Watch
- Oil prices: petroleum is the largest import, so Brent crude is the main swing factor for the deficit.
- Gold imports: a return of gold demand, for example during the festive and wedding season, could add several billion dollars a month to imports.
- Foreign portfolio flows: outflows turned a small current account deficit into a fall in reserves in the April to June quarter.
- Trade agreements: progress on deals with the US and the EU could support exports.
- Next data: October trade figures are due in mid-November, and the RBI’s balance of payments data for July to September is due later in the year.
Who Gains and Who Loses
A weaker rupee affects businesses differently. Exporters, such as engineering, electronics and IT services firms, earn more rupees for each dollar of sales. Importers, such as oil marketing companies, electronics assemblers that buy components abroad and jewellers, pay more.
Hypothetical example: an exporter invoices USD 1 million of engineering goods. At ₹94 per dollar, the receipt is ₹9.4 crore; at ₹96, it is ₹9.6 crore, ₹20 lakh more. An importer paying the same USD 1 million would face the opposite change. Companies with both import costs and export earnings in dollars have a natural hedge and are less exposed.
For importers and exporters, a widening deficit and volatile oil prices argue for a clear hedging policy rather than guessing the rupee’s direction. Indian residents can hedge or trade currency risk only through authorised dealers and recognised exchanges such as NSE and BSE, as permitted under FEMA.
Frequently Asked Questions
What was India’s trade deficit in September 2026?
India’s merchandise trade deficit was USD 30.21 billion in September 2026, with exports of USD 44.40 billion and imports of USD 74.61 billion. Including services, the overall trade deficit was about USD 13.30 billion.
Did India’s trade deficit widen or narrow in September 2026?
It widened from USD 26.86 billion in August but narrowed from about USD 33 billion in September 2025. Exports grew 23% from a year earlier, faster than imports.
Why are India’s imports rising?
Petroleum imports rose about 31% to USD 18.34 billion because of higher oil prices, and electronic goods imports rose about 51% to USD 14.86 billion. A sharp fall in gold imports partly offset these increases.
How does the trade deficit affect the rupee?
A wider trade deficit means importers need more dollars than exporters supply, which tends to weaken the rupee. Services exports, remittances and foreign investment inflows offset part of this pressure.
What is the difference between the trade deficit and the current account deficit?
The trade deficit covers goods, or goods and services. The current account deficit also includes remittances and investment income. India’s current account deficit was USD 4.2 billion, or 0.5% of GDP, in April to June 2026, much smaller than its goods trade deficit.
Conclusion
India’s September 2026 trade data showed strong exports and a manageable deficit on an annual basis, but the half-year trend is wider and oil prices are the main reason. The current account itself remains small thanks to services and remittances; the rupee’s weakness has come more from foreign capital outflows and high oil costs. For USD/INR, the key variables over the coming months are Brent crude, foreign portfolio flows, gold demand and how long the RBI is willing to keep supporting the currency.
Disclaimer
This article is for educational purposes only and does not constitute investment, trading, tax or legal advice. Trade and balance of payments data are provisional and subject to revision. Market levels cited are approximate and drawn from published reports. Examples are hypothetical. Currency and derivatives trading involves substantial risk of loss; Indian residents should deal only through authorised persons and recognised exchanges as permitted under FEMA, and consult a SEBI-registered adviser before making financial decisions.