Introduction
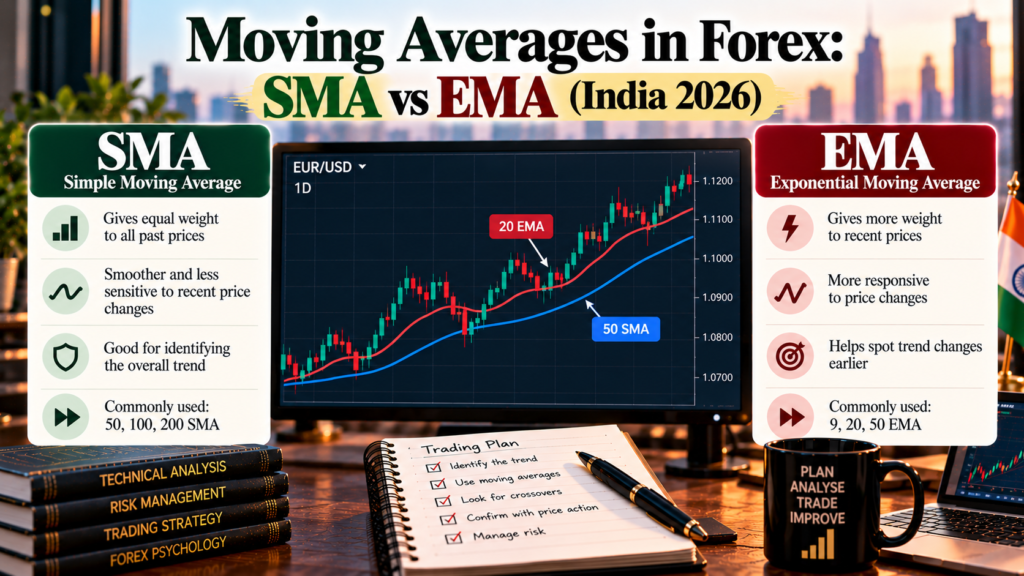
If you open almost any forex chart, you’ll see one or more smooth lines weaving through the candles. Those are moving averages, probably the most widely used indicator in trading. They smooth out day-to-day noise so you can see the underlying direction of price. Understanding the moving average forex basics, especially the difference between the simple (SMA) and exponential (EMA) versions, is one of the first technical skills worth learning.
Quick answer: A moving average is the average price over a set number of periods, recalculated as each new candle forms. The SMA weights every price equally; the EMA gives more weight to recent prices, so it reacts faster but also gives more false signals. Traders use moving averages to identify trend direction (price above a rising average suggests an uptrend), as dynamic support and resistance, and for crossover signals. Moving averages lag price, and research suggests simple moving-average rules in currency markets lost their edge by the early 1990s, so use them as a filter, not a standalone system.
Why this matters
- Moving averages appear in almost every trading platform and many strategies, so understanding them helps you read other traders’ analysis.
- Choosing between SMA and EMA, and between periods such as 20, 50 and 200, changes the signals you get.
- Indian traders can apply moving averages to permitted pairs such as USD/INR futures on NSE or BSE, through a SEBI-registered broker.
SMA and EMA: the formulas
Simple moving average (SMA)
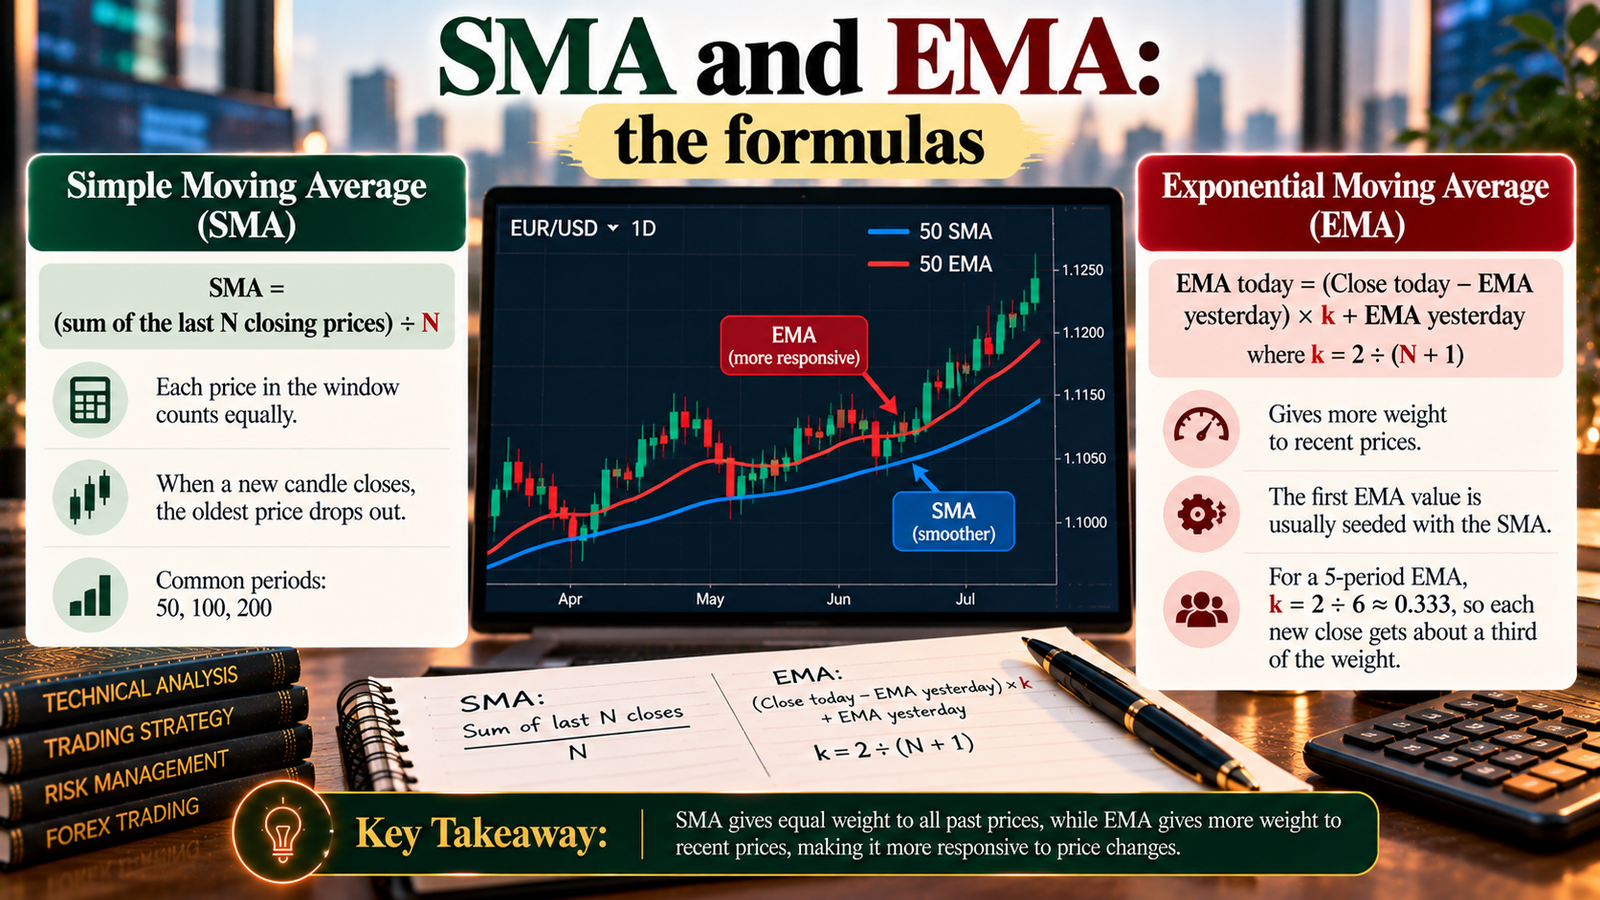
SMA = (sum of the last N closing prices) ÷ N
Each price in the window counts equally. When a new candle closes, the oldest price drops out.
Exponential moving average (EMA)
EMA today = (Close today − EMA yesterday) × k + EMA yesterday, where k = 2 ÷ (N + 1)
The first EMA value is usually seeded with the SMA. For a 5-period EMA, k = 2 ÷ 6 ≈ 0.333, so each new close gets about a third of the weight.
Worked calculation: 5-period SMA and EMA (illustrative USD/INR closes)
| Day | Close | 5-period SMA | 5-period EMA |
|---|---|---|---|
| 1 | 95.10 | — | — |
| 2 | 95.20 | — | — |
| 3 | 95.15 | — | — |
| 4 | 95.30 | — | — |
| 5 | 95.40 | 95.2300 | 95.2300 (seeded with SMA) |
| 6 | 95.35 | 95.2800 | 95.2700 |
| 7 | 95.50 | 95.3400 | 95.3467 |
| 8 | 95.70 | 95.4500 | 95.4644 |
| 9 | 95.90 | 95.5700 | 95.6096 |
| 10 | 96.10 | 95.7100 | 95.7731 |
Calculated in code; prices are illustrative.
Notice that as prices rise quickly on days 8–10, the EMA pulls ahead of the SMA. By day 10 it’s about 6 paise higher, because it weights the latest closes more heavily.
SMA vs EMA at a glance
| SMA | EMA | |
|---|---|---|
| Weighting | Equal weight to every price in the period | More weight to recent prices |
| Speed | Slower to react | Faster to react |
| False signals | Fewer | More, especially in ranges |
| Lag | More | Less, but still lags |
| Typical use | Long-term trend (e.g. 200-day), widely watched levels | Shorter-term trends and entries (e.g. 20 or 50) |
| Best in | Steady trends | Faster-moving trends |
Common moving average periods
| Period | Often used for |
|---|---|
| 9–21 | Short-term momentum and pullbacks on intraday or daily charts |
| 50 | Medium-term trend |
| 100 | Medium to long-term trend |
| 200 | Long-term trend; one of the most widely watched levels |
These are conventions, not magic numbers. What matters is picking one set, testing it, and using it consistently.
How traders use moving averages
1. Trend filter
The simplest use: only look for buys when price is above a rising long-term average (say the 200-day), and only look for sells when price is below a falling one. This keeps you trading with the broader direction.
2. Dynamic support and resistance
In trends, price often pulls back towards a moving average such as the 20 or 50 EMA before continuing. Traders watch these areas for entries, combined with price action.
3. Crossovers
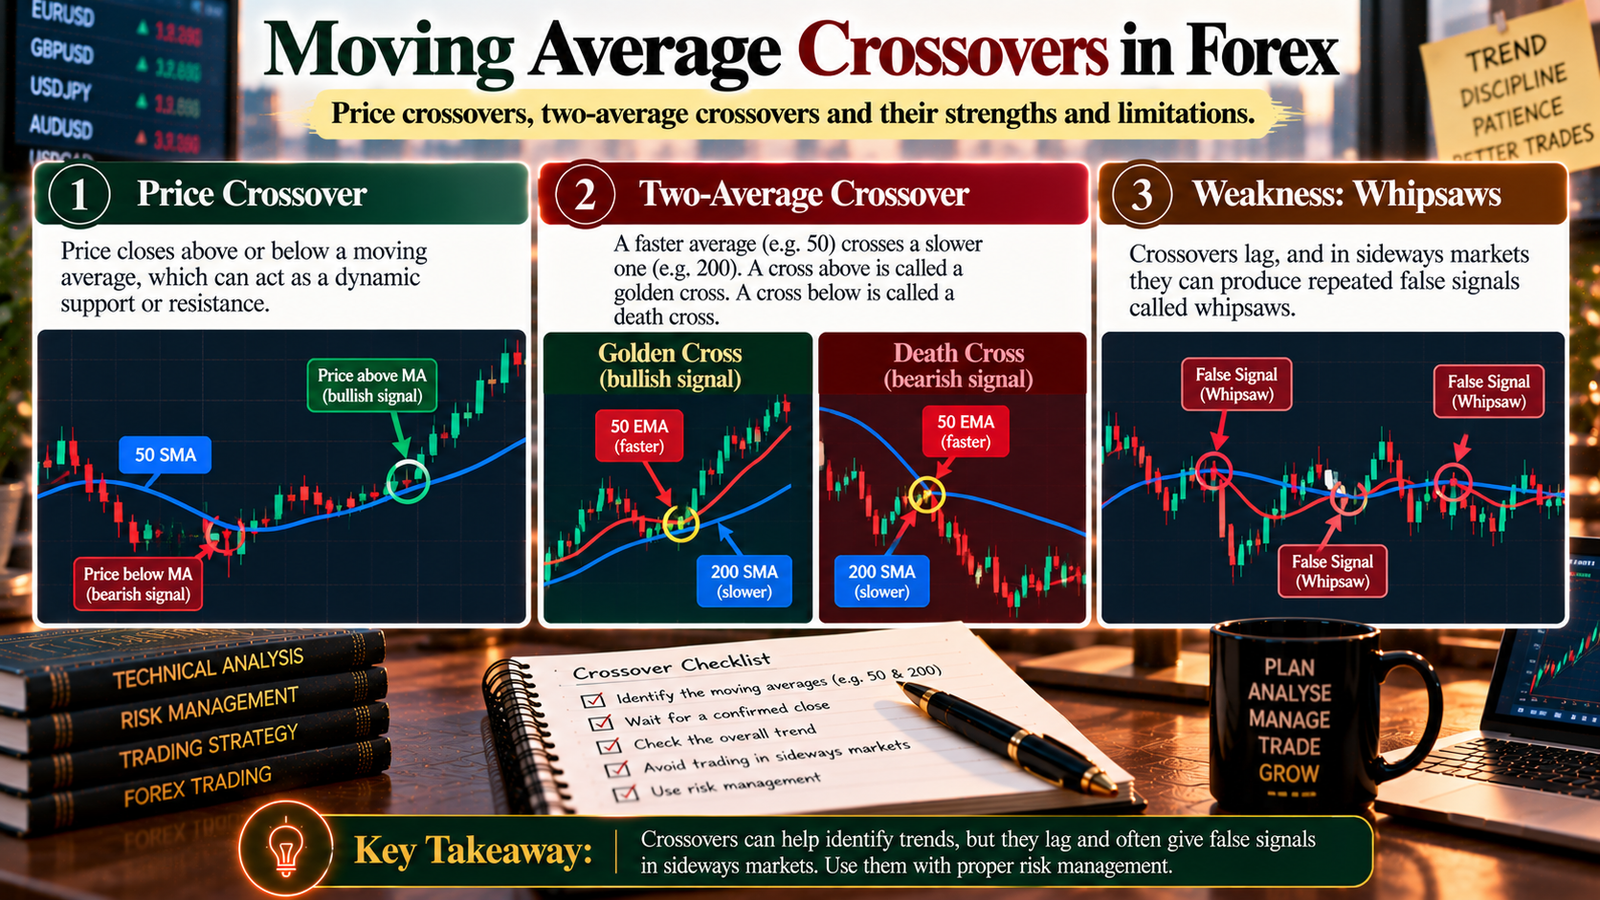
- Price crossover: price closes above or below a moving average.
- Two-average crossover: a faster average (e.g. 50) crosses a slower one (e.g. 200). A cross above is often called a golden cross, a cross below a death cross.
- Weakness: crossovers lag, and in sideways markets they produce repeated false signals called whipsaws.4
What does the evidence say?
Fact: In a classic 1992 study in the Journal of Finance, Brock, Lakonishok and LeBaron tested simple moving-average and trading-range rules on the Dow Jones index over roughly 1897–1986 and found results supporting their predictive ability over that period.
Fact: For currencies, Neely, Weller and Ulrich ran true out-of-sample tests on previously studied rules. They found that excess returns to filter and moving-average rules in the 1970s and 1980s were genuine, but that those opportunities had disappeared by the early 1990s. Returns to less-studied rules also declined.
Analysis: Once a simple rule becomes widely known, its edge tends to shrink. That doesn’t make moving averages useless. They remain a clear, objective way to define trend and structure a plan. But a basic crossover rule on its own shouldn’t be expected to produce reliable profits today.
Worked example: USD/INR futures pullback (illustrative)
Suppose USD/INR futures are above a rising 200-day SMA (uptrend) and pull back to the 50-day EMA near 95.60, where a bullish rejection candle forms.
| Item | Value |
|---|---|
| Entry (buy limit) | 95.60 |
| Stop-loss (below recent swing low) | 95.35 |
| Target (prior high) | 96.10 |
| Risk per lot | (95.60 − 95.35) × 1,000 = ₹250 |
| Potential reward per lot | (96.10 − 95.60) × 1,000 = ₹500 |
| Reward-to-risk | 2 : 1 |
| Capital and risk | ₹1,00,000 at 1% = ₹1,000 |
| Position size | ₹1,000 ÷ ₹250 = 4 lots (risk ₹1,000; potential reward ₹2,000) |
One NSE USD/INR lot is $1,000, so a ₹0.01 move equals ₹10 per lot. Figures are before brokerage, charges and slippage. The trade can fail, which is why the stop and size come first.
Step-by-step: using moving averages
- Choose your time frame and a consistent set of averages (e.g. 50 EMA and 200 SMA).
- Check the slope and position of the long average to define the trend.
- Trade only in the trend’s direction.
- Wait for a pullback towards the shorter average or another support level.
- Look for price action confirmation.
- Set the stop beyond the recent swing, and the target at a prior high or low.
- Size the position from your risk per trade.
- Avoid trading crossovers in obviously sideways markets.
- Record every trade in your journal and review results over 50–100 trades.
Expert analysis
Fact: An SMA weights all prices equally; an EMA uses a smoothing factor k = 2 ÷ (N + 1) to weight recent prices more. Research on currencies found that excess returns from simple moving-average rules seen in the 1970s and 1980s had disappeared by the early 1990s.
Analysis: SMA vs EMA is a trade-off between smoothness and speed. The EMA gets you in and out earlier but whipsaws more in ranges; the SMA filters more noise but reacts later. Neither removes lag, because both are built from past prices. The bigger decision is how you use them: as a trend filter and planning aid, they’re helpful; as a standalone buy/sell signal, the evidence is weak.
Opinion: For beginners, a simple setup is enough: a 200-period SMA to define the trend and a 20 or 50 EMA for pullbacks. Avoid stacking many averages. Test your exact rules on 50–100 trades before relying on them, and always pair them with stops and fixed risk.
Common mistakes
- Using crossovers in sideways markets, which leads to repeated whipsaws.
- Stacking too many averages until the chart says nothing clearly.
- Changing periods after every loss to fit recent data.
- Treating the average as an exact price. It’s a zone, not a wall.
- Ignoring lag. By the time a slow crossover appears, much of the move may be over.
- Trading against the long-term average because price “looks stretched”.
- Skipping stops because the average “will hold”.
Myths vs facts
| Myth | Fact |
|---|---|
| “EMA is always better than SMA.” | EMA is faster but gives more false signals; the better choice depends on your strategy and time frame. |
| “A golden cross guarantees an uptrend.” | Crossovers lag and often fail, especially in ranges. |
| “Moving average rules are proven to make money in forex.” | Research found simple MA rule profits in currencies had disappeared by the early 1990s. |
| “The 200-day average has special power.” | It’s widely watched, which may matter, but it isn’t a law of markets. |
| “More moving averages give better signals.” | More lines usually mean more confusion and easier justification of any trade. |
Key takeaways
- A moving average smooths price to show trend; SMA weights prices equally, EMA favours recent prices.
- EMA formula: (close − previous EMA) × k + previous EMA, with k = 2 ÷ (N + 1).
- Common uses: trend filter, dynamic support and resistance, and crossovers.
- All moving averages lag; crossovers whipsaw in sideways markets.
- Evidence suggests simple MA rules lost their edge in forex; use them as a filter, not a standalone system.
- Plan stop, target and size first. In our example, 4 USD/INR lots risked ₹1,000 for a potential ₹2,000.
FAQs
- What is a moving average in forex? The average price of a currency pair over a set number of periods, recalculated with each new candle, used to smooth price and show trend.
- What’s the difference between SMA and EMA? An SMA weights every price equally; an EMA gives more weight to recent prices, so it reacts faster.
- How do I calculate an SMA? Add the last N closing prices and divide by N.
- How do I calculate an EMA? EMA today = (close today − EMA yesterday) × k + EMA yesterday, where k = 2 ÷ (N + 1). Start with the SMA as the first value.
- Which is better for forex, SMA or EMA? Neither is universally better. EMA suits faster, shorter-term trading; SMA suits smoother, longer-term trend analysis.
- What are the most common moving average periods? 20, 50, 100 and 200 are widely used, with 200 often used to define the long-term trend.
- What is a golden cross? When a shorter moving average (often the 50) crosses above a longer one (often the 200), seen by many as bullish.
- What is a death cross? When the shorter moving average crosses below the longer one, often seen as bearish.
- Do moving average crossovers work? They can capture big trends but lag and whipsaw in ranges. Research on currencies found simple MA rule profits had faded by the early 1990s.
- What is a whipsaw? A series of false signals where price crosses back and forth over a moving average, causing repeated small losses.
- Can I use moving averages on USD/INR? Yes, on any liquid chart, including NSE USD/INR futures traded through a SEBI-registered broker.
- Which time frame is best for moving averages? It depends on your style. Daily charts suit swing trading; lower time frames give more signals and more noise.
- Should I use moving averages alone? It’s better to combine them with support and resistance, price action and risk management.
- Why do moving averages lag? Because they’re calculated from past prices. Shorter periods and EMAs reduce lag but increase false signals.
- Is the 200-day moving average important? Many traders and investors watch it, which can make it a reference point, but it doesn’t guarantee support or resistance.
- How many moving averages should I use? Two is usually enough for beginners, for example a long-term trend average and a shorter one for entries.
- How do I test a moving average strategy? Write exact rules, apply them to 50–100 historical or practice trades, record results in R, and include costs and slippage.