Quick answer
Candlestick patterns are shapes formed by one or more price candles that hint at where the market may head next. This cheat sheet covers the candlestick patterns forex traders watch most – Doji, Hammer, Engulfing, Morning and Evening Stars and more – grouped by whether they signal a reversal or continuation.
Introduction
Candlesticks turn raw price into a story you can read at a glance, and the recurring shapes they form – patterns – are one of the oldest tools in technical analysis. This is a practical cheat sheet: the candlestick patterns forex traders actually use, organised so you can find and recognise them quickly. Keep it beside your charts while the shapes become second nature.
We’ll start with how to read a single candle, then work up through one-, two- and three-candle patterns, and finish with how to use them without getting burned. This is educational content, not investment advice – patterns describe probabilities, never certainties.
Anatomy of a Candlestick
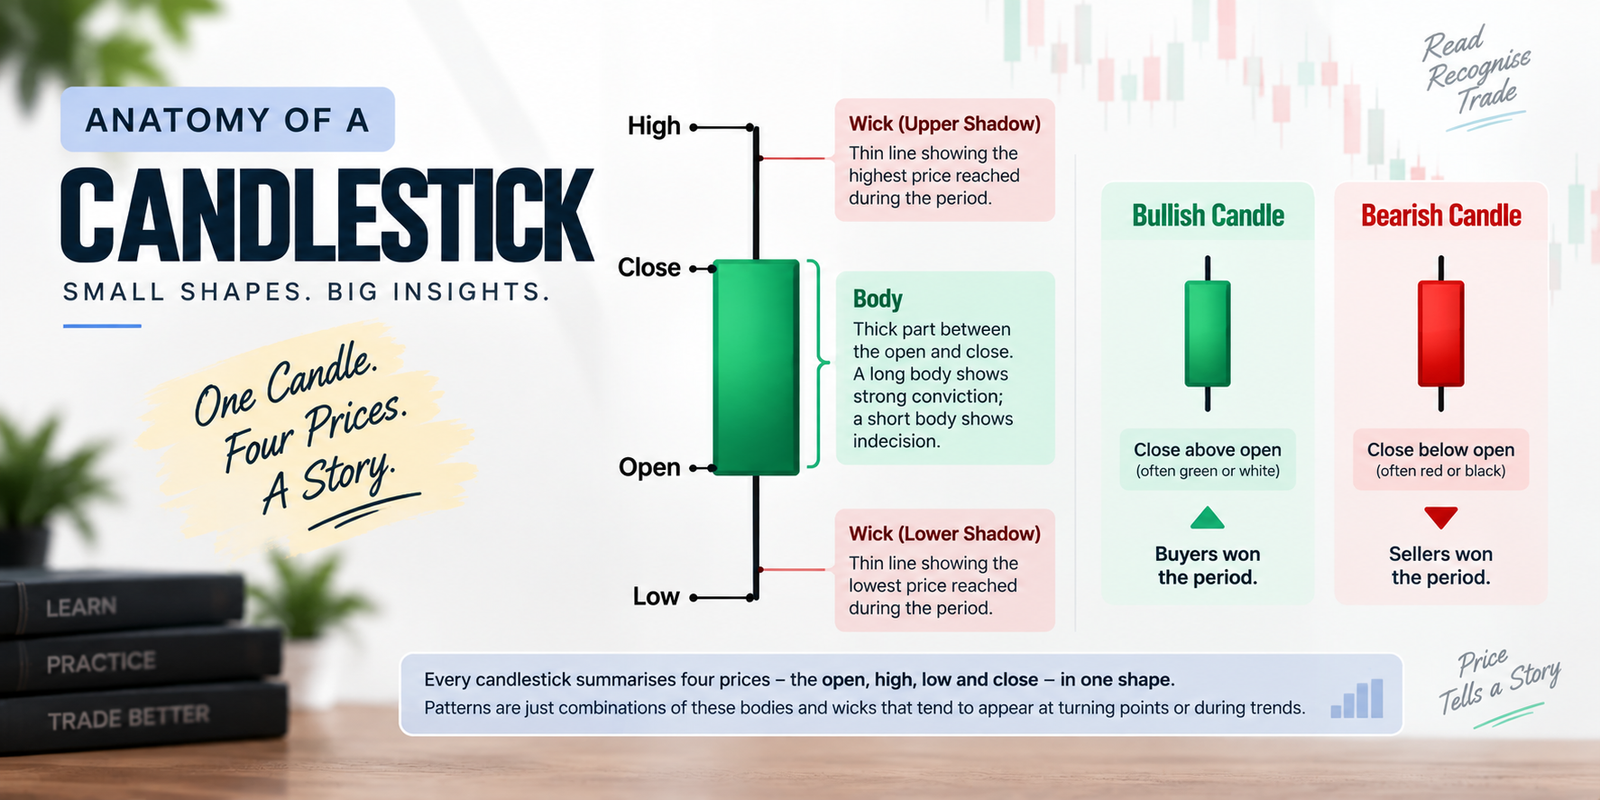
Every candlestick summarises four prices over a period – the open, high, low and close – in one shape:
- Body – the thick part, between the open and close. A long body shows strong conviction; a short body shows indecision.
- Wicks (shadows) – the thin lines above and below the body, marking the high and low reached during the period.
- Bullish candle – close above open (often coloured green or white): buyers won the period.
- Bearish candle – close below open (often red or black): sellers won the period.
Patterns are just combinations of these bodies and wicks that tend to appear at turning points or during trends.
Cheat Sheet 1: Single-Candle Patterns
These form on one candle and often signal a possible reversal, especially after a trend:
| Pattern | Signal | What it looks like / means |
|---|---|---|
| Doji | Indecision | Tiny body, open ~ close – a balance of buyers and sellers |
| Hammer | Bullish reversal | Small body, long lower wick, after a downtrend |
| Inverted Hammer | Bullish reversal | Small body, long upper wick, after a downtrend |
| Shooting Star | Bearish reversal | Small body, long upper wick, after an uptrend |
| Hanging Man | Bearish reversal | Small body, long lower wick, after an uptrend |
| Marubozu | Strong continuation | Full body, little/no wick – one side dominated |
| Spinning Top | Indecision | Small body with wicks on both sides |
Cheat Sheet 2: Two-Candle Patterns
These use a pair of candles, where the second confirms or reverses the first:
| Pattern | Signal | What it looks like / means |
|---|---|---|
| Bullish Engulfing | Bullish reversal | A big up candle fully engulfs the prior down candle |
| Bearish Engulfing | Bearish reversal | A big down candle fully engulfs the prior up candle |
| Piercing Line | Bullish reversal | Down candle, then an up candle closing above its midpoint |
| Dark Cloud Cover | Bearish reversal | Up candle, then a down candle closing below its midpoint |
| Tweezer Bottom | Bullish reversal | Two candles with matching lows after a downtrend |
| Tweezer Top | Bearish reversal | Two candles with matching highs after an uptrend |
Cheat Sheet 3: Three-Candle Patterns
Three-candle patterns are among the more reliable, because they show a shift developing over time:
| Pattern | Signal | What it looks like / means |
|---|---|---|
| Morning Star | Bullish reversal | Down candle, small indecision candle, then a strong up candle |
| Evening Star | Bearish reversal | Up candle, small indecision candle, then a strong down candle |
| Three White Soldiers | Bullish reversal | Three strong up candles in a row after a downtrend |
| Three Black Crows | Bearish reversal | Three strong down candles in a row after an uptrend |
Cheat Sheet 4: Continuation Patterns
Not every pattern signals a reversal – some suggest the current trend will resume after a pause:
| Pattern | Signal | What it looks like / means |
|---|---|---|
| Rising Three Methods | Bullish continuation | A big up candle, a few small pullback candles, then another up candle |
| Falling Three Methods | Bearish continuation | A big down candle, a few small bounce candles, then another down candle |
| Bullish/Bearish Marubozu | Continuation | A full-bodied candle showing one side firmly in control |
Reversal vs Continuation: The Big Picture
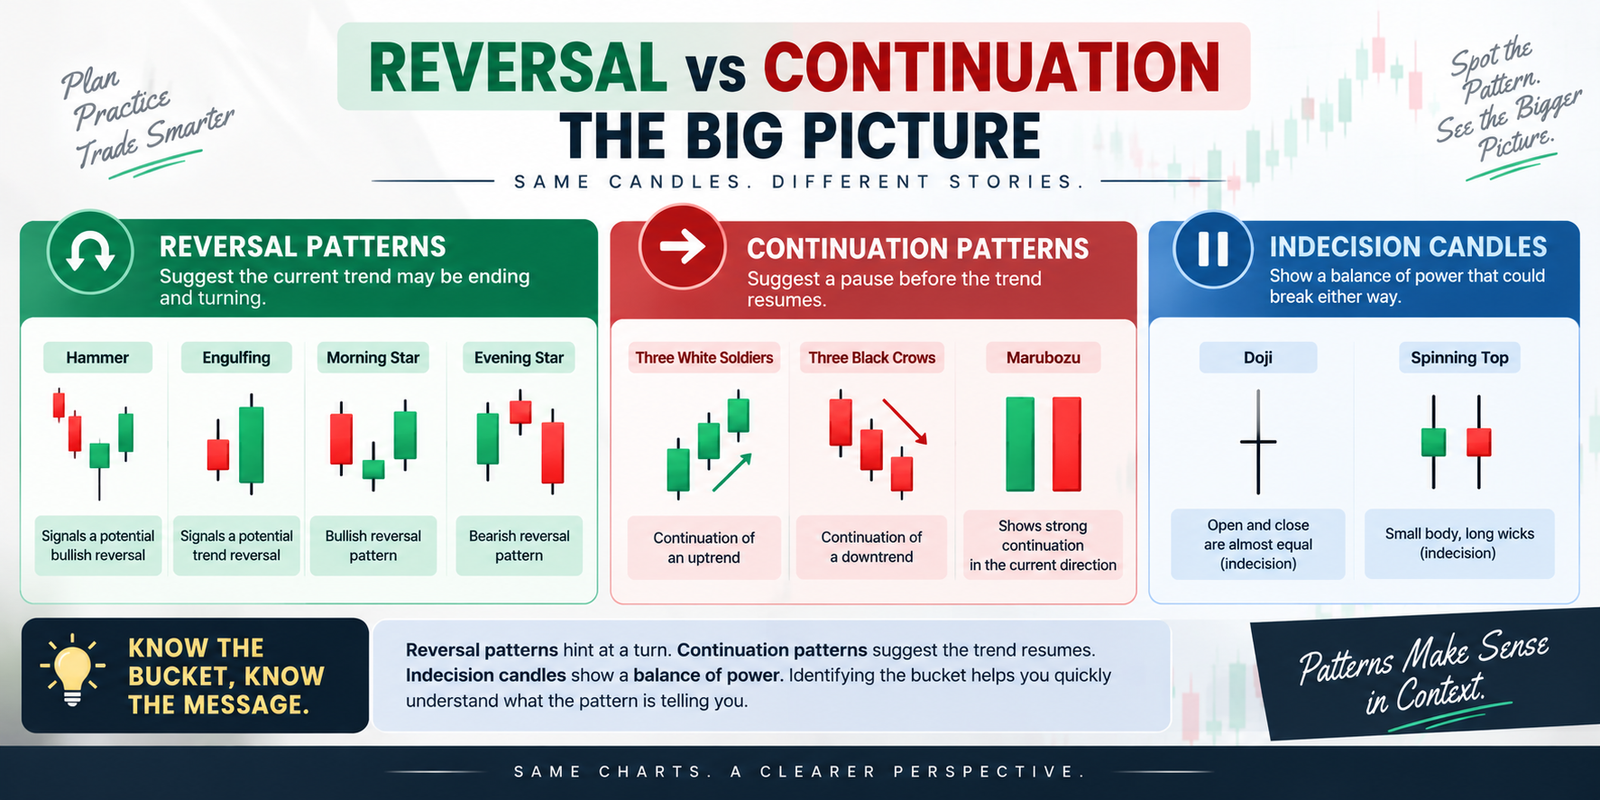
The single most useful way to organise all these patterns is by what they imply. Reversal patterns (Hammer, Engulfing, Morning/Evening Star) suggest the current trend may be ending and turning. Continuation patterns (Three Methods, Marubozu) suggest a pause before the trend resumes. Indecision candles (Doji, Spinning Top) simply flag a balance of power that could break either way. Knowing which bucket a pattern falls into tells you whether it’s hinting at a turn or a continuation – the first question to ask when you spot one.
How to Use Candlestick Patterns (Without Getting Burned)
A pattern on its own is a weak signal. The candlestick patterns forex professionals trade are the ones that appear with supporting evidence:
- Context first – a reversal pattern matters far more at a key support/resistance level or after an extended trend.
- Wait for confirmation – let the next candle confirm the pattern rather than acting on the first hint.
- Combine with indicators – agreement from RSI, MACD or a moving average strengthens the signal.
- Mind the timeframe – patterns on higher timeframes (4-hour, daily) are generally more reliable than on 1-minute charts.
- Always manage risk – place a stop-loss beyond the pattern and size to a fixed, small risk.
Common Mistakes
- Trading a pattern in isolation, ignoring trend and levels.
- Acting on the pattern candle without waiting for confirmation.
- Trusting patterns on very low timeframes where noise dominates.
- Forgetting a stop-loss because the pattern ‘looked strong’.
- Memorising shapes without understanding the buyer-seller story behind them.
Learn more about Inducement in SMC Trading
Myths vs Facts
| Myth | Fact |
|---|---|
| Candlestick patterns predict the future. | They signal probabilities based on past behaviour, not certainties. |
| A pattern alone is enough to trade. | Patterns work best with context, confirmation and risk control. |
| More patterns memorised means more profit. | Understanding the buyer-seller story matters more than the count. |
| Patterns work the same on every timeframe. | Higher timeframes are generally more reliable than very low ones. |
Risk disclaimer
This article is for educational purposes only and is not investment advice. Candlestick patterns describe probabilities, not certainties, and can fail. Trading involves risk of loss. Always use confirmation, context and a stop-loss, trade only through SEBI-registered brokers on recognised exchanges, and consult a qualified professional before trading
Expert Analysis
The real value of a candlestick pattern is not the shape but the story it encodes. Every candle is a record of a battle between buyers and sellers over a fixed period, and a pattern is that battle told across one to three periods. A Hammer, for instance, isn’t magic – it says sellers pushed price down hard, then buyers overwhelmed them and dragged the close back up, which is exactly the kind of exhaustion that can end a downtrend. Traders who memorise names without grasping this narrative end up trading shapes blindly; those who read the story understand why the pattern only matters in the right context – after a real trend, at a level people care about, and confirmed by what comes next.
This is why the candlestick patterns forex professionals actually use are always part of a bigger picture rather than standalone triggers. In isolation, even a textbook Engulfing pattern is little better than a coin flip; layered onto a strong support level, agreeing with momentum, and appearing on a higher timeframe, the same pattern becomes a genuine edge. The cheat sheet above is therefore a starting vocabulary, not a trading system. Learn the shapes so you can spot them instantly, but treat each one as a question – ‘is the story here strong, and does the rest of the chart agree?’ – rather than an answer. Combined with disciplined risk management, that habit turns candlestick reading from pattern-spotting into genuine market analysis.
Key Takeaways
- A candlestick shows the open, high, low and close; patterns are combinations of candles.
- Single-candle signals include the Doji, Hammer and Shooting Star.
- Two- and three-candle patterns (Engulfing, Morning/Evening Star) are often more reliable.
- Group patterns by reversal, continuation or indecision to read them fast.
- Use patterns with context, confirmation and a stop-loss – never in isolation.
Frequently Asked Questions (FAQ)
Q: What are candlestick patterns?
A: Shapes formed by one or more price candles that hint at likely future price behaviour, based on the balance of buyers and sellers.
Q: What is a doji?
A: A candle with almost no body (open and close nearly equal), signalling indecision – a balance between buyers and sellers.
Q: What is a hammer pattern?
A: A candle with a small body and long lower wick appearing after a downtrend, signalling a possible bullish reversal.
Q: What is an engulfing pattern?
A: A two-candle pattern where the second candle’s body fully engulfs the first’s – bullish if up, bearish if down.
Q: What is a shooting star?
A: A candle with a small body and long upper wick after an uptrend, signalling a possible bearish reversal.
Q: What is the morning star pattern?
A: A three-candle bullish reversal: a down candle, a small indecision candle, then a strong up candle.
Q: What is the evening star pattern?
A: A three-candle bearish reversal: an up candle, a small indecision candle, then a strong down candle.
Q: Which candlestick patterns are bullish?
A: Hammer, Bullish Engulfing, Piercing Line, Morning Star, Three White Soldiers and Tweezer Bottom, among others.
Q: Which candlestick patterns are bearish?
A: Shooting Star, Hanging Man, Bearish Engulfing, Dark Cloud Cover, Evening Star and Three Black Crows, among others.
Q: Are candlestick patterns reliable?
A: They describe probabilities, not certainties, and work best with context, confirmation and risk management – not in isolation.
Q: What is the difference between reversal and continuation patterns?
A: Reversal patterns suggest a trend may turn; continuation patterns suggest a pause before the trend resumes.
Q: Do candlestick patterns work in forex?
A: Yes, they are widely used on forex charts, including Indian currency-derivative charts, like any other market.
Q: What timeframe is best for candlestick patterns?
A: Higher timeframes such as 4-hour and daily are generally more reliable than very low timeframes with more noise.
Q: How do I confirm a candlestick pattern?
A: Wait for the next candle to confirm, check the pattern sits at a key level, and look for agreement from indicators.
Q: Can I trade on patterns alone?
A: It’s not advisable. Combine patterns with context, confirmation and a stop-loss for a genuine edge.