Quick answer
Market structure forex is the sequence of swing highs and lows that reveals the trend. Higher Highs (HH) and Higher Lows (HL) make an uptrend; Lower Highs (LH) and Lower Lows (LL) make a downtrend. A Break of Structure confirms the trend; a Change of Character warns it may be reversing.
Introduction
Before indicators, patterns or strategies, there is one skill every trader needs: reading the trend from the chart itself. That skill is market structure – the sequence of peaks and troughs that tells you which way the market is really moving. Master market structure in forex and much of technical analysis falls into place, because almost every other tool is built on top of it.
This guide decodes the four building blocks – HH, HL, LH and LL – and shows how they combine into trends, how breaks of structure signal continuation or reversal, and how to trade with the flow rather than against it. This is educational content, not investment advice.
What Is Market Structure?
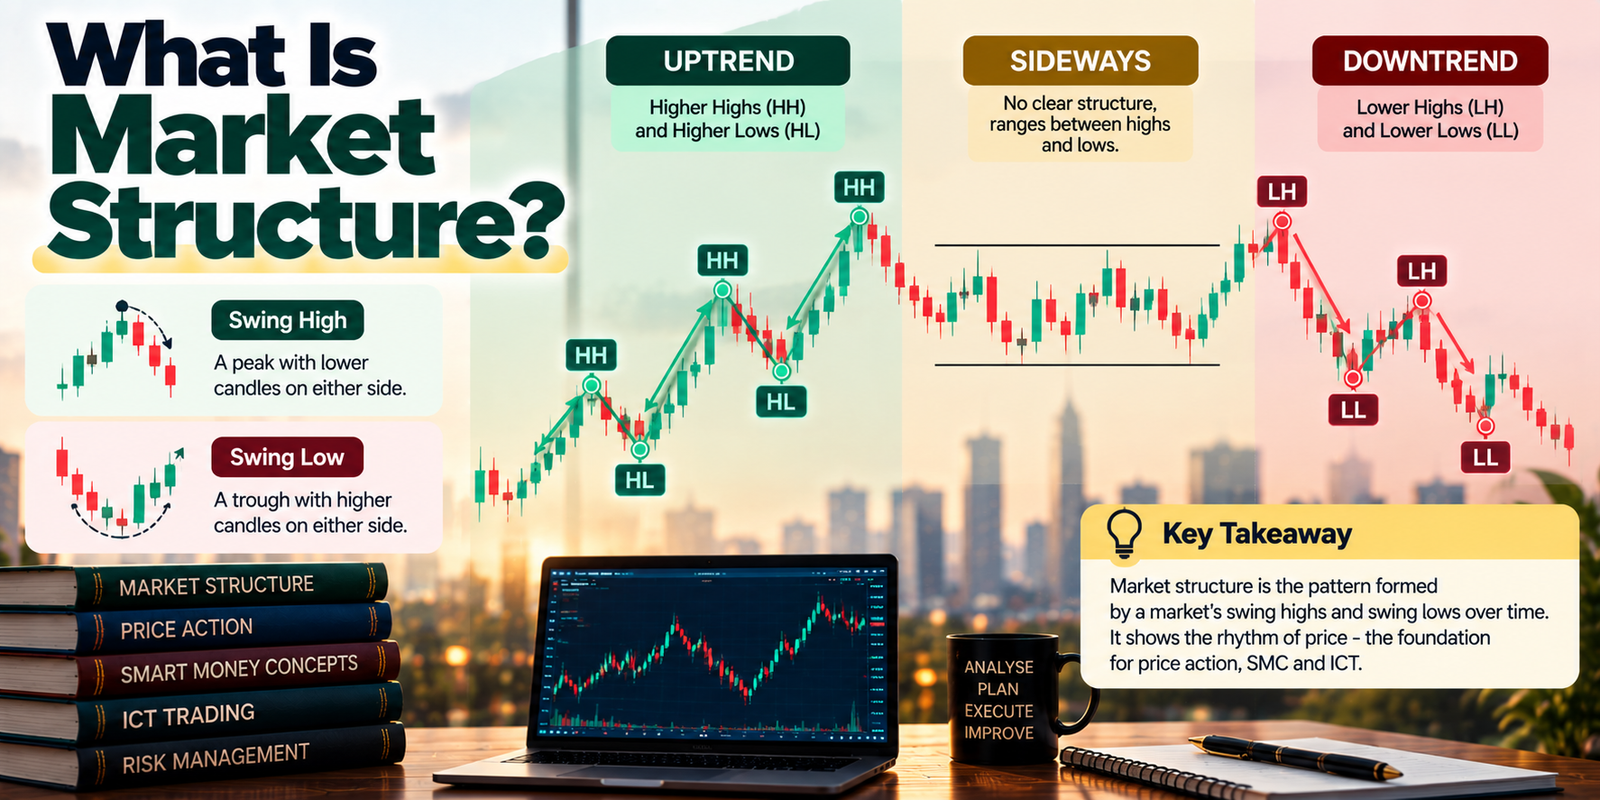
Market structure is simply the pattern formed by a market’s swing highs and swing lows over time. A swing high is a peak with lower candles on either side; a swing low is a trough with higher candles on either side. String these swing points together and you get the skeleton of price – the rhythm of pushes and pullbacks that defines a trend. Reading market structure means reading that rhythm, and it’s the foundation beneath price action, Smart Money Concepts and ICT alike.
The Four Building Blocks: HH, HL, LH, LL
Everything reduces to four labels applied to swing points:
| Label | Meaning | What it signals |
|---|---|---|
| HH – Higher High | A swing high above the previous swing high | Bullish – buyers in control |
| HL – Higher Low | A swing low above the previous swing low | Bullish – dips are being bought |
| LH – Lower High | A swing high below the previous swing high | Bearish – rallies are being sold |
| LL – Lower Low | A swing low below the previous swing low | Bearish – sellers in control |
That’s the entire alphabet of trend. Everything else is combinations of these four.
How the Blocks Build Trends
Combine the labels and the trend reveals itself:
| Structure | Pattern | Meaning |
|---|---|---|
| Uptrend | HH + HL (higher highs and higher lows) | Bullish – trade from the long side |
| Downtrend | LH + LL (lower highs and lower lows) | Bearish – trade from the short side |
| Range | Roughly equal highs and lows, mixed | Sideways – no clear trend; trade edges or wait |
An uptrend is literally a staircase of higher highs and higher lows; a downtrend is a staircase down. When that staircase pattern breaks, the trend is in question – which is where structure breaks come in.
Break of Structure (BOS): Trend Continuation
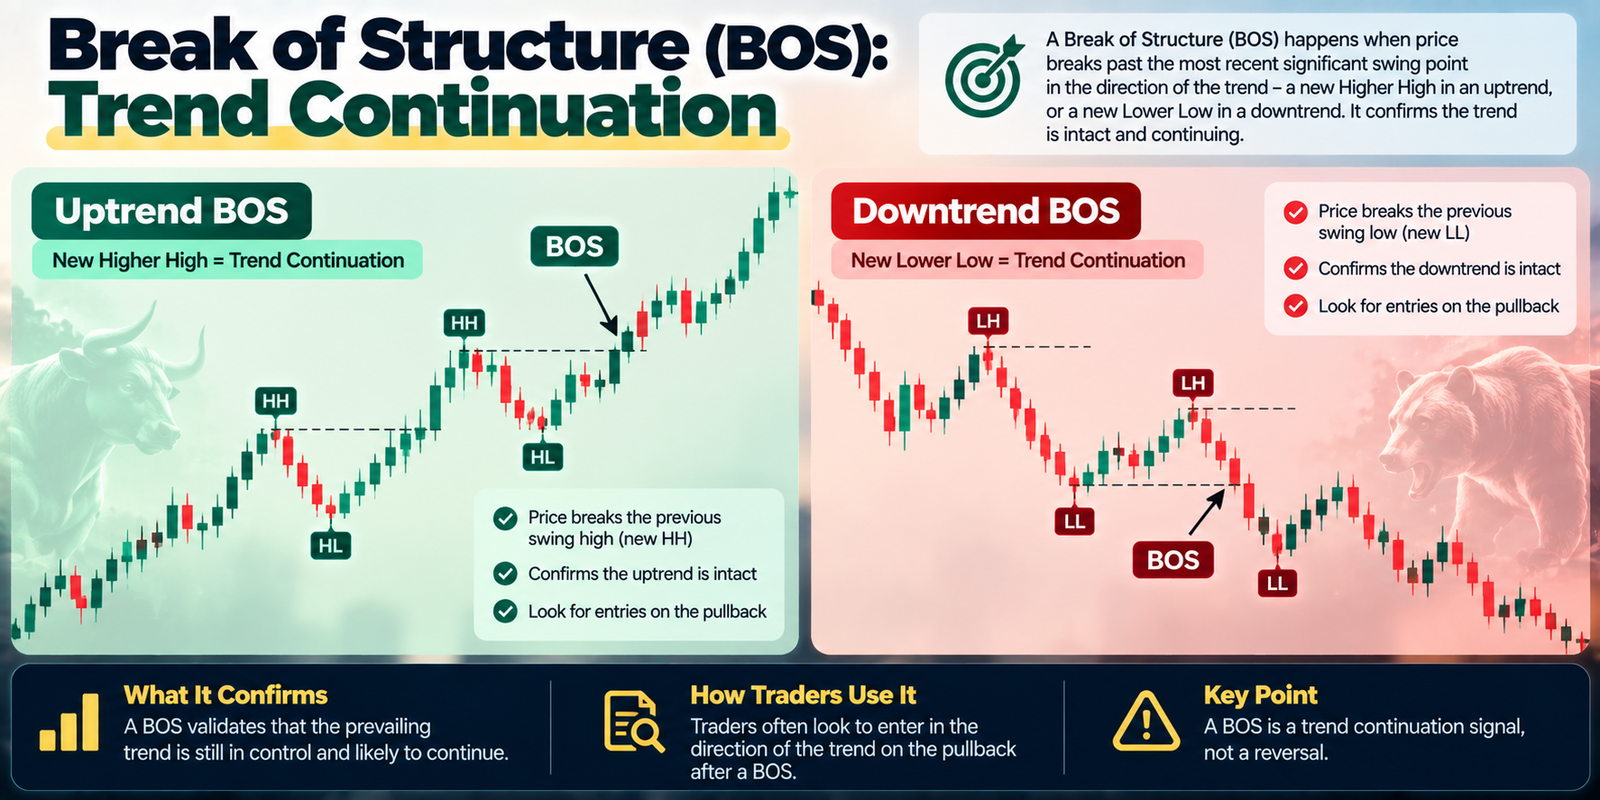
A Break of Structure (BOS) happens when price breaks past the most recent significant swing point in the direction of the trend – a new Higher High in an uptrend, or a new Lower Low in a downtrend. It confirms the trend is intact and continuing. Traders use a BOS as validation that the prevailing direction still holds, and often look to enter on the pullback that follows it.
Change of Character (CHoCH): The First Warning of Reversal
A Change of Character (CHoCH) is the opposite signal – the first time price breaks structure against the prevailing trend. In an uptrend of higher highs and higher lows, a CHoCH occurs when price breaks below the most recent higher low, breaking the pattern for the first time. It doesn’t guarantee a reversal, but it’s the earliest structural hint that momentum may be shifting – the market’s ‘character’ has changed. A CHoCH followed by new lower highs and lower lows confirms a trend change.
Swing Structure vs Internal Structure
Structure exists on every timeframe, and the two layers matter:
- Swing (major) structure – the big, obvious swing points on your higher timeframe, defining the dominant trend.
- Internal (minor) structure – the smaller swings inside a single larger move, visible on lower timeframes.
A common approach is to read the major trend from swing structure on a higher timeframe, then use internal structure on a lower timeframe to time entries in that direction. Confusing the two – trading a minor internal pullback as if it were a major reversal – is a classic beginner error.
How to Mark Market Structure on a Chart
- Zoom out first – start on a higher timeframe to see the dominant swing points clearly.
- Mark the swing highs and lows – identify the significant peaks and troughs, not every tiny wiggle.
- Label them HH, HL, LH, LL – read the sequence to name the trend.
- Watch the latest swing – the most recent high and low are your BOS and CHoCH reference levels.
- Drop a timeframe for entries – use internal structure to time trades in the higher-timeframe direction.
How to Trade With Market Structure
Structure turns into a plan with a few principles:
- Trade with the trend – buy pullbacks (at higher lows) in an uptrend; sell rallies (at lower highs) in a downtrend.
- Use BOS as confirmation – a fresh break in the trend direction supports staying with it.
- Respect a CHoCH – treat the first counter-trend break as a caution, and a confirmed reversal as a reason to switch bias.
- Define invalidation – your stop belongs beyond the swing point that would prove your read wrong.
- Avoid ranges – if highs and lows are roughly equal, there’s no trend to follow; wait for a breakout.
Common Mistakes
- Marking every minor wiggle as a swing point and drowning in noise.
- Confusing internal (minor) structure with major swing structure.
- Calling a reversal on the first pullback instead of waiting for a CHoCH.
- Trading against a clear higher-timeframe trend.
- Forcing a trend read onto a market that’s actually ranging.
Learn more about Mitigation Blocks Explained
Myths vs Facts
| Myth | Fact |
|---|---|
| Market structure is complicated. | It’s just the sequence of swing highs and lows – four labels. |
| A break lower always means reversal. | The first counter break (CHoCH) is a warning; confirmation needs new LH/LL. |
| Structure is the same on every timeframe. | Each timeframe has its own; align higher-timeframe trend with lower-timeframe entries. |
| You need indicators to read the trend. | Market structure reads the trend from price alone. |
Risk disclaimer
This article is for educational purposes only and is not investment advice. Reading market structure improves analysis but does not guarantee outcomes, and structure breaks can fail. Trading involves risk of loss, and most retail traders lose money. Always use a stop-loss and sound position sizing, trade only through SEBI-registered brokers on recognised exchanges, and consult a qualified professional before trading.
Expert Analysis
Market structure is the closest thing trading has to a universal language, which is why it deserves to be learned before anything flashier. Every method that follows – support and resistance, chart patterns, Smart Money Concepts, ICT – is ultimately a dialect of the same underlying grammar: markets move in swings, those swings make higher or lower peaks and troughs, and the sequence tells you who is winning. A trader who can look at a bare chart and correctly say ‘this is an uptrend making higher highs and higher lows, and the last higher low is my line in the sand’ already has more of an edge than one juggling five indicators without a directional read. The four labels are almost embarrassingly simple, but the discipline of applying them consistently is what separates traders who trade with the market from those who fight it.
The subtlety that trips people up is the distinction between a pullback and a reversal, and structure is precisely the tool that resolves it. In a healthy uptrend, every dip looks momentarily like the end of the world, but as long as price keeps making higher lows, the trend is simply breathing. The structural signal to respect is the Change of Character – the first time price breaks the pattern by taking out a higher low – because that, not fear or a red candle, is the objective evidence that momentum may be turning. Anchoring decisions to swing points rather than emotions imposes exactly the patience most retail traders lack: you hold with the trend until structure says otherwise, and you flip your bias only when a CHoCH is confirmed by fresh lower highs and lower lows. Combined with a stop placed at the swing that would invalidate the read, market structure converts the vague question ‘is the trend over?’ into a concrete, rule-based answer – which is the whole point of technical analysis.
Key Takeaways
- Market structure is the sequence of swing highs and lows that defines the trend.
- HH + HL = uptrend; LH + LL = downtrend; roughly equal highs/lows = range.
- A Break of Structure confirms trend continuation; a Change of Character warns of reversal.
- Align higher-timeframe swing structure with lower-timeframe internal structure for entries.
- Trade with the trend, place stops at invalidating swings, and avoid trendless ranges.
Frequently Asked Questions (FAQ)
Q: What is market structure in forex?
A: The sequence of swing highs and lows that reveals the trend – higher highs and lows in an uptrend, lower highs and lows in a downtrend.
Q: What do HH, HL, LH, LL mean?
A: Higher High, Higher Low, Lower High and Lower Low – the four swing-point labels used to read the trend.
Q: How do I know if it’s an uptrend?
A: The market makes higher highs and higher lows – each peak and trough is above the last.
Q: How do I know if it’s a downtrend?
A: The market makes lower highs and lower lows – each peak and trough is below the last.
Q: What is a range in market structure?
A: A sideways market with roughly equal highs and lows and no clear trend; traders wait or trade the edges.
Q: What is a Break of Structure (BOS)?
A: When price breaks the most recent significant swing point in the trend’s direction, confirming the trend is continuing.
Q: What is a Change of Character (CHoCH)?
A: The first break of structure against the prevailing trend – an early warning that the trend may be reversing.
Q: Is a lower low always a reversal?
A: Not necessarily. The first counter-trend break is a warning; a confirmed reversal needs a new pattern of lower highs and lower lows.
Q: What is the difference between swing and internal structure?
A: Swing structure is the major trend on a higher timeframe; internal structure is the smaller swings inside a move on a lower timeframe.
Q: How do I mark market structure?
A: Zoom out, mark the significant swing highs and lows, label them HH/HL/LH/LL, and watch the latest swing as your BOS/CHoCH reference.
Q: How do I trade with market structure?
A: Trade with the trend – buy higher lows in an uptrend, sell lower highs in a downtrend – with stops beyond the invalidating swing.
Q: Which timeframe should I use?
A: Read the dominant trend on a higher timeframe and time entries on a lower one; higher timeframes are more reliable.
Q: Does market structure work on Indian markets?
A: Yes. It reads trend from price and applies to any market, including forex and Indian currency derivatives.
Q: Do I need indicators for market structure?
A: No. Market structure reads the trend from price alone, though indicators can add confirmation.
Q: How does market structure relate to SMC and ICT?
A: Both are built on market structure; BOS and CHoCH are core structural signals used throughout Smart Money Concepts and ICT.