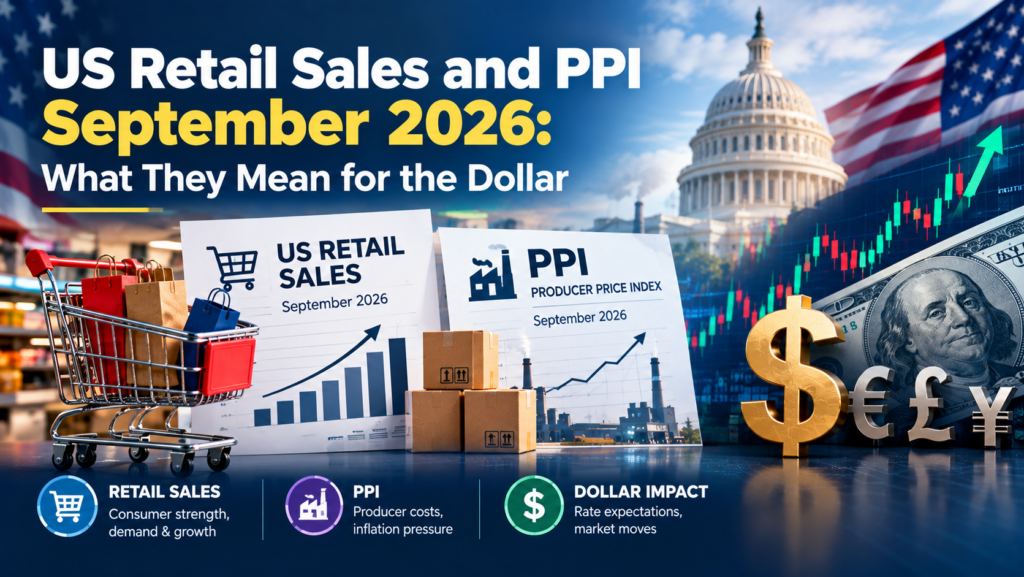
A day after a hot consumer inflation report, the US released two more important data points on 15 October 2026. Producer prices rose at their fastest monthly pace since 2022, and retail sales beat forecasts. On paper, both pointed to a stronger dollar. Instead, the dollar fell about 0.5% and Treasury yields dropped.
This article explains the September US retail sales and PPI figures, why the details mattered more than the headlines, how the dollar, gold and the rupee reacted, and what Indian traders should take from the release.
US Retail Sales and PPI September 2026 at a Glance
US retail and food services sales rose 0.8% in September 2026 to USD 745.0 billion, according to the Census Bureau, against a forecast of 0.3%. The Producer Price Index for final demand rose 1.3% for the month and 6.3% over the year, according to the Bureau of Labor Statistics, against forecasts of about 0.5% to 0.6%. In both reports, gasoline prices drove most of the increase, and underlying demand was much softer than the headlines suggested.
Retail Sales
| Measure | September 2026 | Forecast | August 2026 |
|---|---|---|---|
| Retail and food services, month on month | 0.8% | 0.3% | 1.3% (revised from 1.1%) |
| Retail and food services, year on year | 6.3% | n/a | n/a |
| Excluding autos | 0.9% | n/a | n/a |
| Control group | 0.1% | 0.3% | 1.2% |
| Gasoline stations | 6.4% | n/a | n/a |
Source: US Census Bureau advance estimate, 15 October 2026;
Producer Price Index
| Measure | Month on month | Year on year |
|---|---|---|
| Final demand (headline) | 1.3% | 6.3% |
| Final demand less foods, energy and trade services | 0.5% | 5.0% |
| Final demand goods | 2.6% | n/a |
| Final demand energy | 10.8% | n/a |
| Final demand services | 0.8% | n/a |
Source: US Bureau of Labor Statistics, PPI release of 15 October 2026.
Inside the Retail Sales Report
Gasoline Inflated the Headline
Sales at gasoline stations rose 6.4% in September and 28.1% over the year. According to Experts breakdown of the Census data, gas stations accounted for about USD 4.1 billion of the USD 5.7 billion monthly increase in total sales. Excluding gas stations, sales rose only 0.2%.
Retail sales are measured in nominal terms, so higher prices lift the figure even when people buy the same amount. TD Economics estimated that, adjusted for inflation, September sales volumes rose just 0.1%.
The Control Group Disappointed
The control group excludes autos, gasoline, building materials and food services, and feeds directly into the government’s estimate of consumer spending in GDP. It rose only 0.1% in September, below the 0.3% forecast and well down from 1.2% in August.
The categories were mixed. TD Economics reported gains in furniture (1.3%), health and personal care (0.7%) and electronics (0.6%), while miscellaneous stores fell 3.0%, building materials fell 0.6% and general merchandise declined. Food services and drinking places rose 1.1% and are up 7.0% over the year, which suggests that spending on eating out is holding up.
TD said consumer spending was tracking an annualised pace of about 3.6% in the July to September quarter, slightly below the previous quarter, and expects it to cool as high energy costs, elevated interest rates and a low saving rate weigh on households.
Inside the PPI Report
Energy Drove the Jump
The 1.3% monthly rise in final demand prices was the largest since 2022. Final demand energy prices rose 10.8%, and the BLS said half of the increase in final demand goods prices came from gasoline, which jumped 20.3%. Diesel, jet fuel and electricity also rose. Oil prices have been above USD 100 a barrel through September and into October because of the Middle East conflict and attacks on shipping.
Underlying Pressure Is Also Rising
The less volatile measure, which excludes food, energy and trade services, rose 0.5% for the month and 5.0% over the year. Services prices rose 0.8%, helped by a 1.4% increase in trade margins, which measure the markup that wholesalers and retailers earn.
PPI matters because it measures prices that businesses receive at earlier stages of production. A 6.3% annual increase in producer prices, compared with 3.7% consumer inflation, suggests that companies are facing cost increases that could still pass through to consumers. Some PPI components also feed into the Personal Consumption Expenditures (PCE) price index, the Fed’s preferred inflation measure.
Why the Dollar Fell After Strong Data
The release came out at 8:30 AM Eastern Time, or 6:00 PM IST. Experts reported that the dollar jumped against all major currencies at first, then gave up the gain within about ten minutes. By the end of the US session, the moves were as follows (approximate figures, as reported by Experts):
| Market | Move on 15 October |
|---|---|
| US Dollar Index (DXY) | Down about 0.5%, to near 102.0 |
| US 10-year Treasury yield | Down about 6 basis points, to near 5.09% |
| USD/JPY | Dipped toward 157.6, then recovered above 158 |
| USD/CAD | Dollar at its lowest against the Canadian dollar, near 1.4170, as oil rose |
| Gold | Up 1.6%, to near USD 4,170 an ounce |
| WTI crude oil | Up 2.2%, to near USD 98 a barrel |
| S&P 500 | Up 0.3%, to near 7,740 |
Four factors explain why markets looked past the strong headlines.
- Both beats came from gasoline. Traders treated the headline numbers as an energy price shock rather than a sign of broad overheating. The Fed usually looks through energy price swings when setting policy.
- The control group pointed to slower growth. Real spending barely rose, which made a further rate hike look less necessary.
- Fed officials sounded patient. San Francisco Fed President Mary Daly said the Fed did not need to move in October. New York Fed President John Williams said he had “no reason to believe that we would need to do more” beyond one more hike this year.
- Bonds rallied. Treasury yields fell after their spike on CPI day, which reduced the dollar’s yield advantage.
As a result, the CME FedWatch tool showed the probability of an October rate hike below 30% on the morning of 15 October, according to a Yahoo Finance report, with about 70.7% odds of no change. That was well below the peak of about 50% reached after the CPI report a day earlier.
Three Days, One Round Trip
Put together, the week’s data produced a full round trip for the dollar. The Dollar Index traded near 102.0 before the CPI release on 14 October, peaked between about 102.7 and 103.0 after it, and was back near 102.0 after the retail sales and PPI data. Traders who bought the dollar on the CPI headline and held it through the following day were left with little or no gain.
What It Means for the Indian Rupee
Rupee contracts on Indian exchanges stop trading at 5:00 PM IST, an hour before the US data, so USD/INR responded the next morning. The rupee closed at 94.99 per dollar on 15 October and opened at 94.75 on 16 October, trading near 94.79 in early deals, according to PTI reports. Traders cited the weaker dollar, lower US yields and the Reserve Bank of India’s measures to stabilise the currency.
Two factors limited the rupee’s gains. Brent crude remained high at about USD 105 a barrel, which keeps India’s import bill elevated. Foreign institutional investors also sold about ₹5,285 crore of Indian equities on 15 October, adding to dollar demand.
The Energy Channel
The US data and India’s own inflation tell the same story. India’s wholesale inflation reached 11.39% in September, with fuel and power up 25.85%. When the same oil shock lifts US producer prices and Indian wholesale prices, the rupee faces pressure through India’s trade deficit even on days when the dollar is weak globally.
Hypothetical example: an Indian importer needs USD 100,000 for a crude cargo. At ₹95 per dollar, the cost is ₹95 lakh. If the rupee strengthens to ₹94.75 after a weak-dollar day, the cost falls to ₹94.75 lakh, a saving of ₹25,000. If the oil price rises 2% at the same time, the dollar bill becomes USD 102,000 and the rupee cost rises to about ₹96.6 lakh, more than wiping out the currency gain.
Lessons for Indian Traders
- Read the details, not the headline. In September, the control group and the core PPI measure told a different story from the headline beats.
- Separate price effects from volume. Nominal retail sales rise when prices rise. Inflation-adjusted figures from analysts give a better picture of demand.
- Expect the first move to fade. On both 14 and 15 October, the dollar’s initial reaction reversed within hours, and on 15 October within minutes.
- Plan around Indian trading hours. US data released at 6:00 PM IST reaches USD/INR only at the next day’s open, while exchange-listed cross pairs such as EUR/USD trade until 7:30 PM.
- Trade only through permitted channels. Indian residents can trade currency derivatives only through authorised brokers on recognised exchanges such as NSE and BSE, as permitted under FEMA.
What to Watch Next
- 16 October 2026: Fed Chair Kevin Warsh speaks at the IMF.
- 27 to 28 October 2026: FOMC meeting. The fed funds target range is 3.75% to 4.00% after a hike on 16 September.
- 10 November 2026: October CPI.
- 13 November 2026: October PPI.
- 17 November 2026: October retail sales.
Check the Risk-On / Risk-Off Meter here!
Frequently Asked Questions
What were US retail sales for September 2026?
US retail and food services sales rose 0.8% in September 2026 to USD 745.0 billion, above the 0.3% forecast. Sales were up 6.3% from a year earlier. The control group, which excludes volatile categories, rose only 0.1%.
What was US PPI for September 2026?
The Producer Price Index for final demand rose 1.3% for the month and 6.3% over the year, the largest monthly increase since 2022. Excluding food, energy and trade services, it rose 0.5% for the month and 5.0% over the year.
Why did the dollar fall after strong retail sales and PPI?
Gasoline prices drove most of both increases, the control group showed weak underlying spending, and Fed officials said they could wait before raising rates again. Treasury yields fell, and the Dollar Index dropped about 0.5% to near 102.0.
What is the retail sales control group?
The control group excludes autos, gasoline, building materials and food services. It is used to estimate consumer spending in GDP and is often a better guide to underlying demand than the headline figure.
How does US PPI affect the rupee?
PPI affects the rupee mainly through expectations for US interest rates and the dollar. Higher US rates usually strengthen the dollar and weaken emerging market currencies. In September, the energy shock behind US PPI also raised India’s oil import costs, which adds pressure on the rupee.
What time are US retail sales and PPI released in India?
Both are released at 8:30 AM Eastern Time. That is 6:00 PM IST during US daylight saving time and 7:00 PM IST after the US moves to standard time in November.
Conclusion
The September 2026 US retail sales and PPI reports looked strong on the surface: sales up 0.8% and producer prices up 1.3% for the month. Underneath, gasoline did most of the work, real consumer spending barely grew, and the Fed signalled patience. The market’s reaction showed that traders are focusing on underlying demand and Fed guidance rather than on energy-driven headlines. For Indian traders, the result was a softer dollar and a firmer rupee, but high oil prices and foreign outflows remain the bigger risks for USD/INR.
Disclaimer
This article is for educational purposes only and does not constitute investment, trading, tax or legal advice. Economic data are preliminary and subject to revision. Market levels cited are approximate and drawn from published reports. Examples are hypothetical. Currency and derivatives trading involves substantial risk of loss; Indian residents should trade only through authorised persons and recognised exchanges as permitted under FEMA, and consult a SEBI-registered adviser before making financial decisions.