
Introduction
Your broker’s P&L statement tells you what happened: how much you made or lost. It doesn’t tell you why. Was the loss a good trade that simply didn’t work, or a rule you broke out of boredom? Only a trading journal can answer that. If you want to know how to keep a trading journal that actually improves your results, this guide gives you a template to copy, filled examples and a simple weekly review routine.
Quick answer: To keep a trading journal, record every trade with the same fields: date, instrument, setup, direction, entry, stop-loss, target, position size, exit, result in ₹ and in R (multiples of the amount you risked), whether you followed your rules, and a one-line note on your emotions and lessons. Fill it in within minutes of closing each trade. Then review it weekly: calculate win rate, average win and loss in R, expectancy and rule adherence, and pick one thing to improve next week.
Why a journal matters
- Fact: A 2016 meta-analysis by Harkin and colleagues, covering 138 studies and 19,951 participants, found that monitoring progress toward a goal improved goal attainment (d = 0.40). The effect was stronger when progress was physically recorded or reported. These studies weren’t about trading, but the principle carries over.
- Fact: SEBI found that over 91% of individual equity F&O traders made net losses in FY25, and 71% of individual intraday traders in the equity cash segment made net losses in FY23.
- Analysis: A journal won’t change those odds by itself. What it does is show you, in your own data, which setups make money, which mistakes cost the most, and whether you’re improving, so decisions are based on evidence instead of memory and mood.
The trading journal template
Copy these columns into a spreadsheet or notebook. Keep the same fields for every trade so you can compare them later.
| # | Field | What to write | Why it matters |
|---|---|---|---|
| 1 | Date and time | Entry and exit times | Shows which sessions and days suit you |
| 2 | Instrument | e.g. USD/INR futures (Oct expiry) | Shows where your edge is |
| 3 | Setup | The name of the setup from your plan | Lets you compare setups |
| 4 | Direction | Long or short | Reveals bias |
| 5 | Entry price | Actual fill | Needed for results |
| 6 | Stop-loss | Price and ₹ risk (1R) | Makes R-multiples possible |
| 7 | Target | Planned exit price | Shows whether you let winners run |
| 8 | Position size | Lots or units | Checks sizing discipline |
| 9 | Exit price and reason | Target, stop, time or manual | Separates plan exits from emotional exits |
| 10 | Result in ₹ | Net of brokerage and charges | Your real outcome |
| 11 | Result in R | Result ÷ amount risked | Compares trades of different sizes |
| 12 | Rules followed? | Yes or no; which rule if no | Measures discipline |
| 13 | Emotion | One word before and after (calm, anxious, bored, greedy) | Links behaviour to mood |
| 14 | Screenshot | Chart at entry and exit | Lets you review what you actually saw |
| 15 | Lesson | One sentence | Turns each trade into learning |
Sample entries (illustrative)
These are made-up entries to show how a completed journal looks. Risk per trade is ₹1,000 (1R).
| Date | Instrument | Setup | Dir. | Exit reason | Result (₹) | R | Rules followed? | Emotion | Lesson |
|---|---|---|---|---|---|---|---|---|---|
| 1 Oct | USD/INR fut | Pullback to support | Long | Target | +2,000 | +2.0 | Yes | Calm | Waiting for the candle close worked |
| 1 Oct | USD/INR fut | None (boredom) | Short | Stop | −1,000 | −1.0 | No: no setup | Bored | Took a trade without a setup; skip when bored |
| 3 Oct | EUR/INR fut | Breakout retest | Long | Manual, early | +500 | +0.5 | No: exited before target | Anxious | Price later hit the target; trust the plan |
Pre-trade and post-trade sections
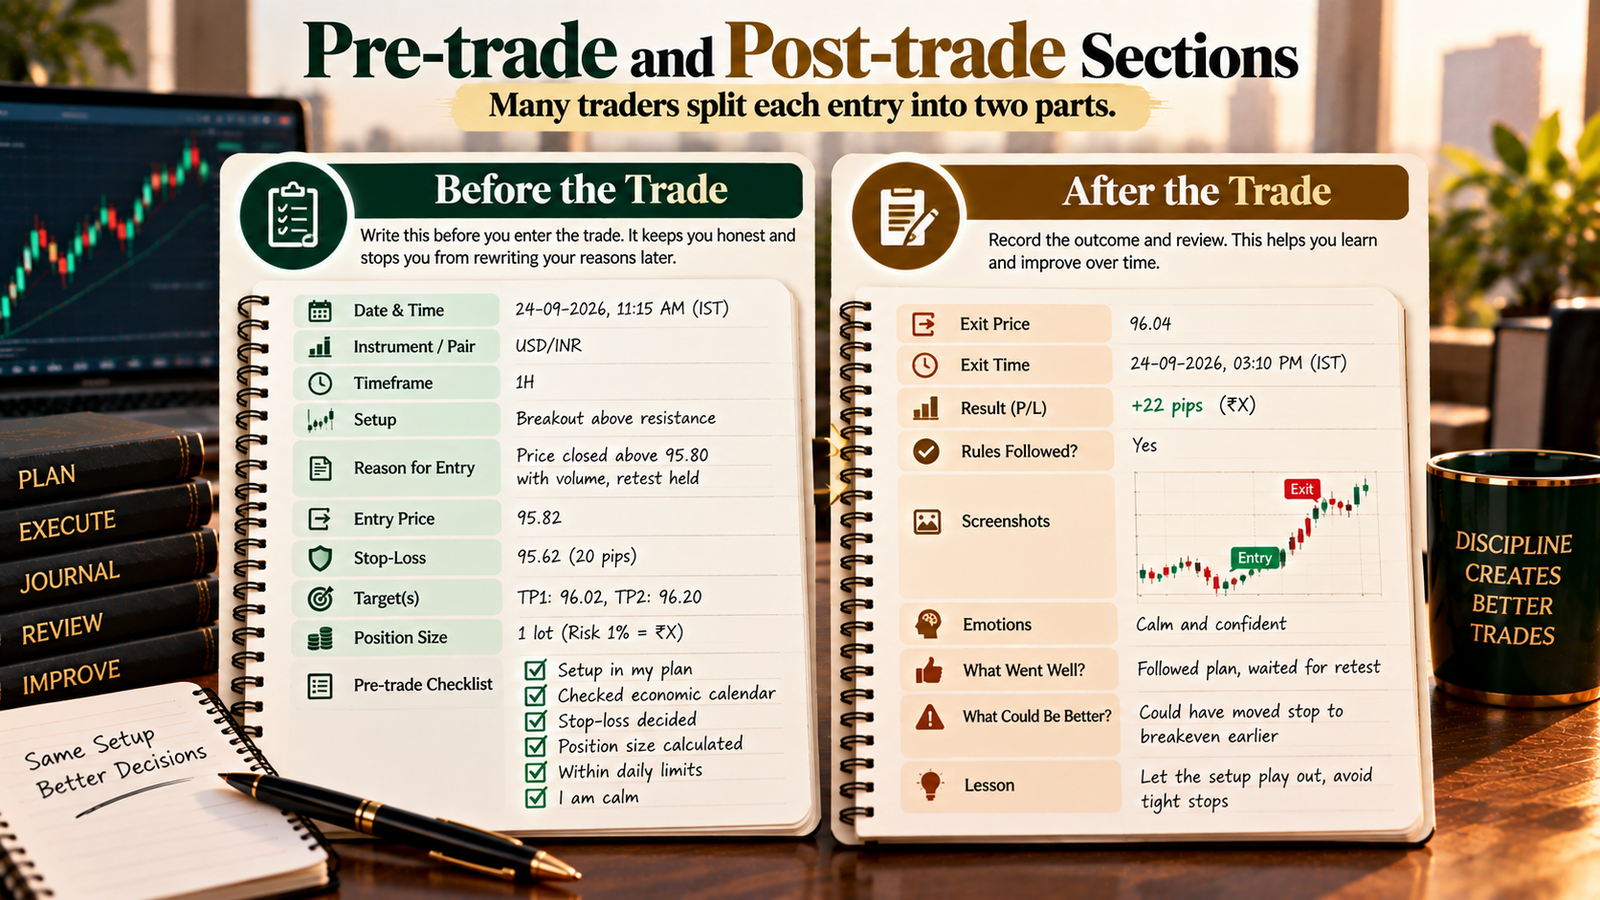
Many traders split each entry into two parts:
- Before the trade: setup, reason for entry, stop, target, size, and the checklist ticked. Writing this before you enter stops you from rewriting your reasons afterwards.
- After the trade: exit, result, rules followed, emotion and lesson.
Daily and weekly notes
Alongside individual trades, add a short daily note (market conditions, sleep, distractions, whether you hit your daily loss limit) and a weekly summary using the review method below.
How to keep a trading journal: step by step
- Choose one tool and stick with it. A spreadsheet is enough for most beginners.
- Set up your columns using the template above before your next session.
- Fill in the pre-trade section before you enter. If you can’t name the setup, don’t take the trade.
- Complete the post-trade section within minutes of closing. Memory rewrites losses quickly.
- Take screenshots of the chart at entry and exit, and link or paste them in.
- Log every trade, including small ones, mistakes and trades you’re embarrassed about. A journal with only good trades is useless.
- Review weekly using the metrics below.
- Pick one improvement per week and write it at the top of next week’s page.
The weekly review: metrics that matter
Worked example (illustrative)
Ten trades in a week, risking ₹1,000 (1R) on each. Results in R: +2.0, −1.0, −1.0, +1.5, −1.0, +2.2, −0.5, −1.0, +3.0, −1.0. Rules were broken on three trades (results −1.0, −0.5 and −1.0).
| Metric | Formula | Result |
|---|---|---|
| Win rate | Winning trades ÷ total trades | 4 ÷ 10 = 40% |
| Average win | Sum of winning R ÷ number of wins | 8.7 ÷ 4 = +2.18R |
| Average loss | Sum of losing R ÷ number of losses | −5.5 ÷ 6 = −0.92R |
| Expectancy | Total R ÷ number of trades | 3.2 ÷ 10 = +0.32R per trade |
| Profit factor | Gross wins ÷ gross losses (in R) | 8.7 ÷ 5.5 = 1.58 |
| Result in ₹ | Total R × ₹1,000, then minus costs | ₹3,200 − ₹1,500 (assumed ₹150 × 10) = ₹1,700 |
| Rule adherence | Trades with rules followed ÷ total trades | 7 ÷ 10 = 70% |
| Rule-following trades | Total R of those 7 trades | +5.7R |
| Rule-breaking trades | Total R of those 3 trades | −2.5R |
What this tells you: the setup looks positive (+0.32R per trade), but the three rule-breaking trades cost 2.5R. That’s worth about ₹2,500, more than the week’s net profit of ₹1,700. The one improvement for next week is obvious: eliminate the trades that break rules.
Ten trades is far too few to judge a strategy. Use weekly reviews to spot behaviour; use 50 to 100 trades or more before drawing conclusions about the setup itself.
Questions to ask every week
- Which setup produced the best and worst R?
- What was my most expensive mistake?
- Did I take any trades without a setup?
- Did I exit winners before target or move stops?
- Which emotions show up before my losing trades?
- What’s the one thing I’ll change next week?
Which tool should you use?
| Tool | Pros | Cons | Best for |
|---|---|---|---|
| Paper notebook | Simple; writing slows you down to think | No automatic calculations | Absolute beginners, pre-trade planning |
| Spreadsheet (Excel or Google Sheets) | Free, flexible, easy formulas and charts | Manual entry | Most beginners |
| Journal apps and software | Automatic stats, tags, charts; some import broker data | Often paid; data stored with a third party | Active traders with many trades |
Whatever you choose, the discipline of filling it in matters more than the tool.
Records for tax filing in India
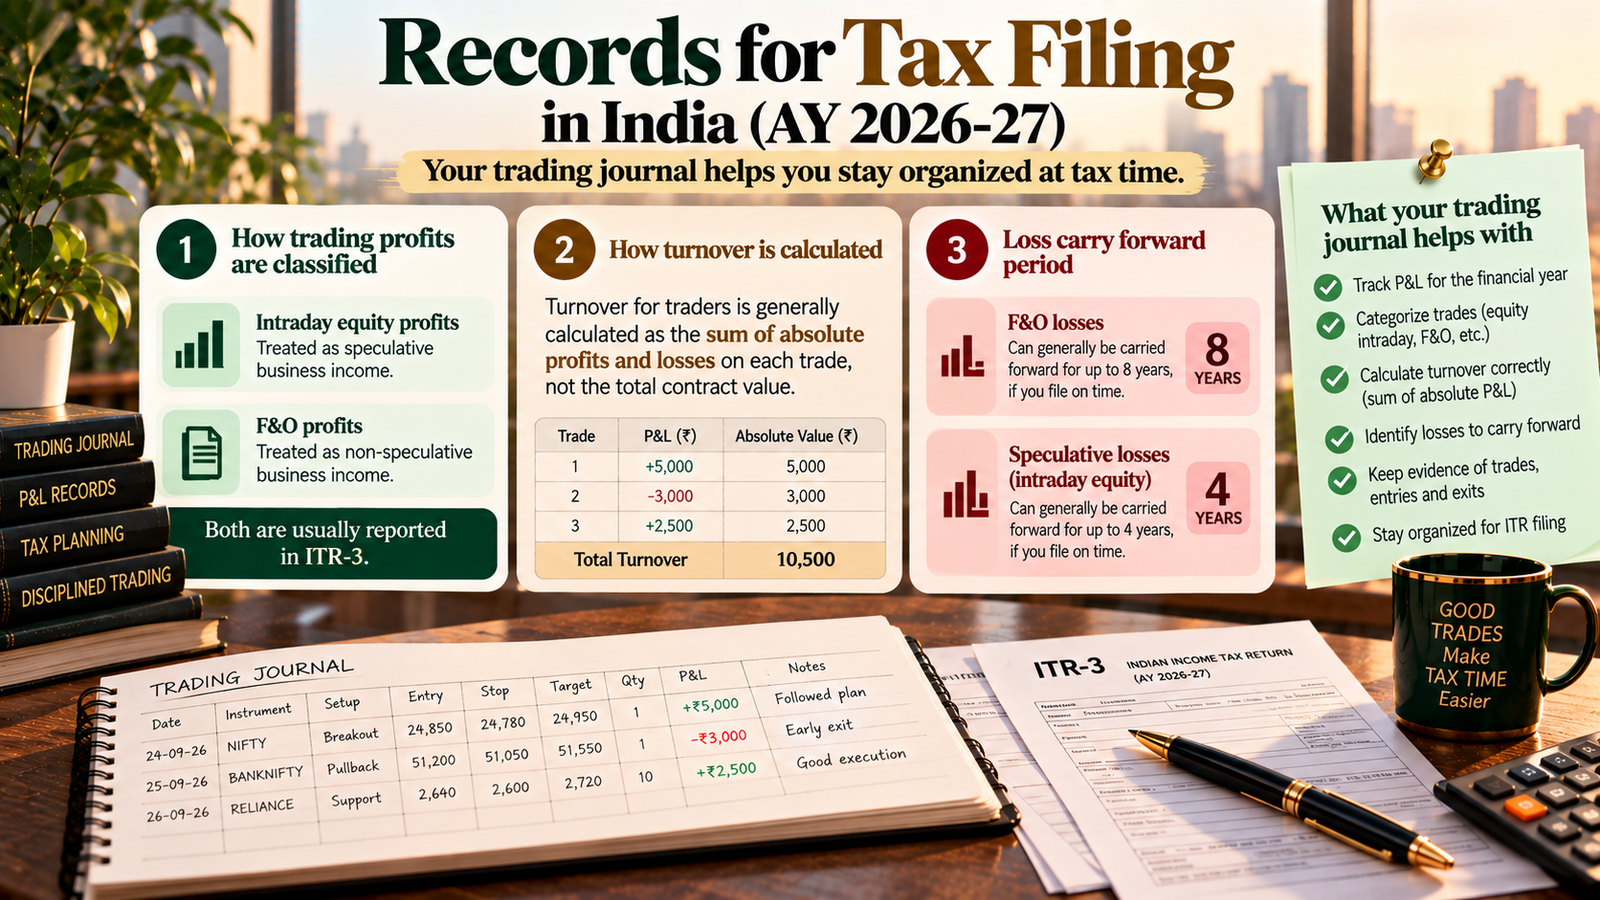
A journal is a performance tool, not a tax record, but it helps at filing time. Per current tax guides for AY 2026-27:
- Intraday equity profits are treated as speculative business income, and F&O profits as non-speculative business income. Both are usually reported in ITR-3.
- Turnover for traders is generally calculated as the sum of absolute profits and losses on each trade, not the total contract value.
- F&O losses can generally be carried forward for up to 8 years and speculative losses for up to 4, if you file on time.
Keep your broker’s contract notes, tax P&L and ledger alongside your journal, and confirm the treatment with a chartered accountant. The rules are detailed and can change.
Expert analysis
Fact: Research on goal monitoring shows that tracking progress improves goal attainment, especially when the tracking is written down. SEBI’s data shows most individual intraday and F&O traders in India lose money.
Analysis: A journal’s real value is separating three things that a P&L statement mixes together: the quality of your strategy, the quality of your execution and plain luck. Recording results in R rather than rupees lets you compare trades fairly, and the “rules followed?” column shows exactly how much indiscipline costs you.
Opinion: Beginners often build elaborate journals with 30 columns and abandon them in two weeks. Start with the essentials (setup, entry, stop, exit, R, rules followed, one-line lesson) and add fields only when you have a question the journal can’t answer. A simple journal kept every day beats a perfect one kept for a week.
Common mistakes
- Logging only some trades. Skipping the bad ones hides the most useful data.
- Filling it in hours or days later. Details and emotions are forgotten or rewritten.
- Recording only rupees, not R. Rupee results change with position size and make comparison hard.
- Never reviewing. A journal that isn’t reviewed is just a diary.
- Making it too complicated. Too many fields leads to skipped entries.
- Writing vague lessons such as “be more careful”. Write specific, actionable ones: “no entries in the first 15 minutes”.
- Changing strategy after one bad week. Judge setups over a large sample.
- Ignoring costs. Always record results net of brokerage and charges.
Myths vs facts
| Myth | Fact |
|---|---|
| “My broker’s P&L report is my journal.” | It shows results but not setups, reasons, rule-following or emotions. |
| “Journaling is only for full-time traders.” | Beginners gain the most because their mistakes are frequent and fixable. |
| “I’ll remember my trades.” | Details fade quickly, and it’s easy to remember a trade the way you wish it had gone. Written records don’t change. |
| “A journal needs expensive software.” | A free spreadsheet or notebook works well. |
| “A high win rate means a good strategy.” | Expectancy matters more: average win, average loss and win rate together. |
Key takeaways
- Record every trade with the same fields, including result in R and whether you followed your rules.
- Write the pre-trade section before entering and the post-trade section within minutes of closing.
- Review weekly: win rate, average win and loss, expectancy, profit factor and rule adherence.
- Compare rule-following and rule-breaking trades to see what indiscipline costs.
- Keep it simple enough to maintain every day.
- Keep broker contract notes and tax P&L alongside your journal for ITR filing, and check with a CA.
FAQs
- What is a trading journal? A record of every trade you take: what you traded, why, how you managed it, the result, whether you followed your rules and what you learned.
- How do I start a trading journal? Create a spreadsheet with the template columns in this guide, fill in the pre-trade section before each entry and the post-trade section right after each exit.
- What should I write in a trading journal? Date, instrument, setup, direction, entry, stop-loss, target, size, exit and reason, result in ₹ and R, rules followed, emotion, screenshot and a one-line lesson.
- What is R in a trading journal? R is the amount you risked on the trade. A result of +2R means you made twice what you risked; −1R means you lost the full amount risked.
- How often should I review my trading journal? Briefly after each session and in depth once a week, with a monthly look at longer-term patterns.
- What is expectancy? The average result per trade, usually in R. Positive expectancy means your trades have made money on average over the sample.
- What is profit factor? Gross profits divided by gross losses. Above 1 means winners outweighed losers over the period.
- Is Excel good enough for a trading journal? Yes. Excel or Google Sheets can calculate win rate, expectancy and adherence with simple formulas.
- Should I journal losing trades? Especially losing trades. They often contain the clearest lessons about rule-breaking and risk.
- Do I need screenshots? They help a lot. A chart at entry and exit shows what you actually saw, not what you remember.
- How long before my journal shows useful patterns? Behaviour patterns can show up within a few weeks. Judging a strategy needs a larger sample, often 50 to 100 trades or more.
- Should intraday traders keep a journal? Yes. Intraday traders take many trades, so small repeated mistakes add up quickly, and a journal makes them visible.
- Can a trading journal help with taxes? It helps organise your records, but for ITR filing use your broker’s contract notes and tax P&L, and consult a chartered accountant.
- What’s the difference between a trading journal and a trading plan? The plan sets your rules in advance; the journal records what actually happened and whether you followed the plan.
- Should I track emotions in my journal? Yes, briefly. One word before and after each trade can reveal patterns such as losses after boredom or anxiety.
- What if I forget to fill in my journal? Fill in what you can from broker records, note the gap, and return to logging from the next trade. Don’t abandon the habit.
- Are paid journal apps worth it? They can save time for active traders through automatic statistics and imports. Beginners can start with a free spreadsheet.