Introduction to Williams %R indicator
Some indicators try to do many things at once. The Williams %R indicator does one thing well: it shows where the current price closed relative to its recent high-low range. That simple measurement makes it a fast, responsive tool for spotting overbought and oversold conditions and timing entries.
Developed by trader Larry Williams, the indicator is popular with forex, stock and index traders, especially for short-term and swing trading. Because it reacts quickly, it can give early signals, but it also needs careful filtering to avoid false ones.
This guide explains:
- What Williams %R is and how it is calculated
- How to read the −20 and −80 levels
- The best settings for different styles
- Practical strategies with entry and exit rules
- A worked example, comparisons and common mistakes
What Is the Williams %R Indicator?
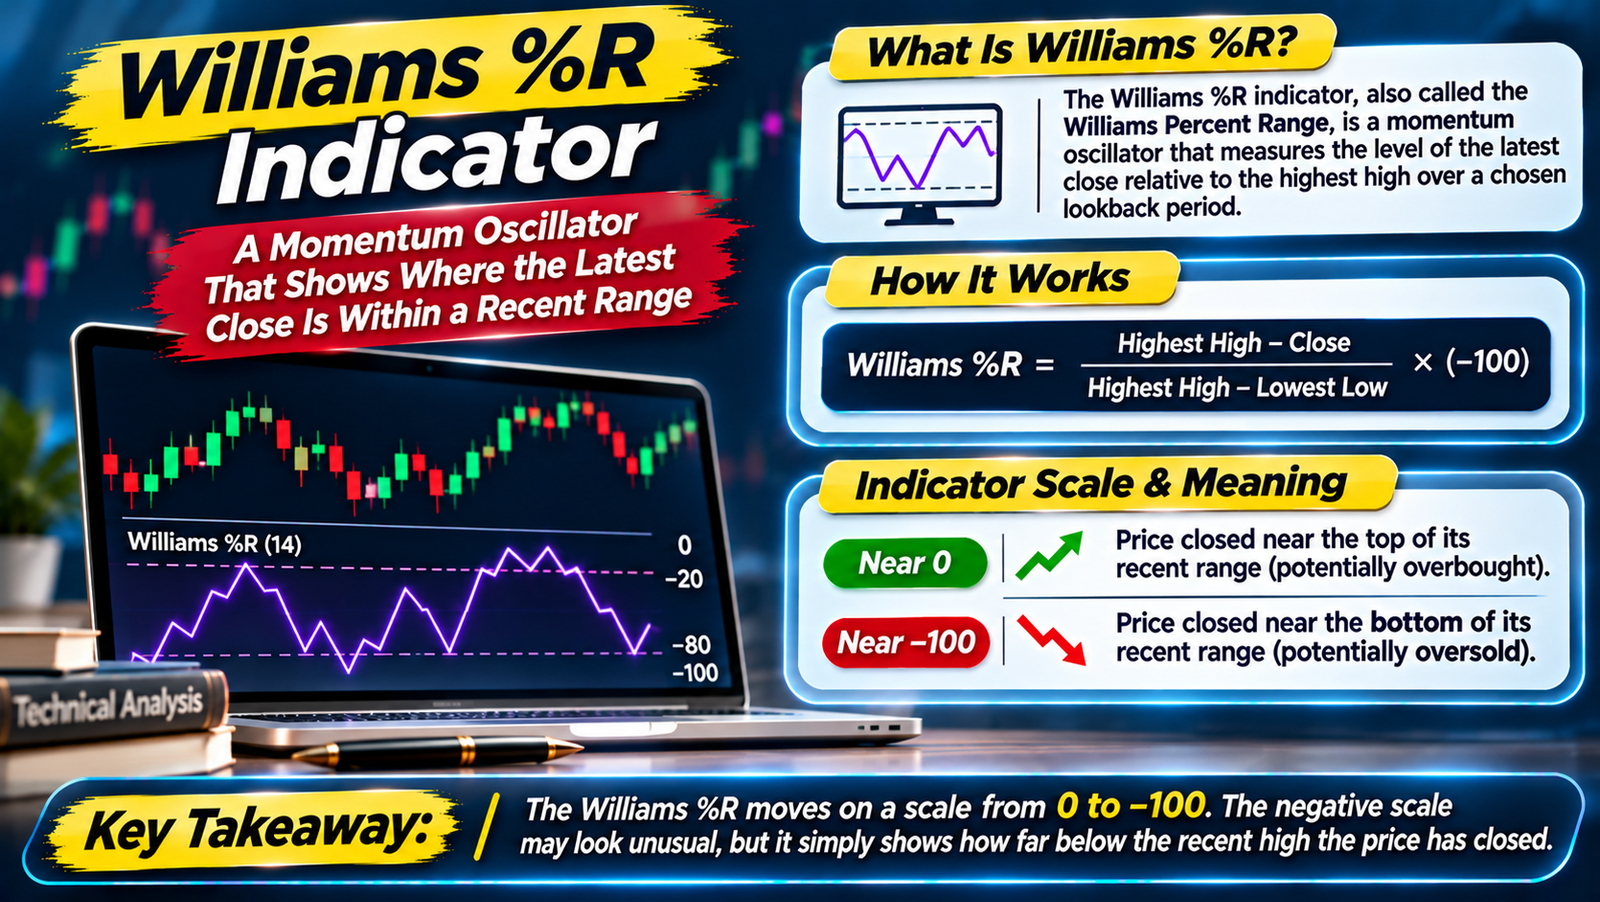
The Williams %R indicator, also called the Williams Percent Range, is a momentum oscillator that measures the level of the latest close relative to the highest high over a chosen look back period. It was introduced by Larry Williams in the 1970s.
The indicator moves on a scale from 0 to −100:
- Readings near 0 mean price closed near the top of its recent range.
- Readings near −100 mean price closed near the bottom of its recent range.
The negative scale can look unusual at first, but it simply reflects how far below the recent high the price has closed.
The Williams %R Formula
%R = (Highest High − Close) ÷ (Highest High − Lowest Low) × −100
- Highest High: The highest price over the look back period, usually 14 periods.
- Lowest Low: The lowest price over the same period.
- Close: The most recent closing price.
Calculation example
Suppose over the last 14 periods on EUR/USD:
- Highest high: 1.1700
- Lowest low: 1.1600
- Latest close: 1.1680
%R = (1.1700 − 1.1680) ÷ (1.1700 − 1.1600) × −100 = 0.0020 ÷ 0.0100 × −100 = −20
A reading of −20 means the close is in the top 20% of the recent range, at the edge of the overbought zone. Your charting platform does this calculation automatically.
How to Read the Williams %R Indicator
| Reading | Interpretation |
|---|---|
| 0 to −20 | Overbought: price is closing near the top of its recent range |
| −20 to −50 | Upper half of the range; bullish momentum |
| −50 | Midpoint of the range |
| −50 to −80 | Lower half of the range; bearish momentum |
| −80 to −100 | Oversold: price is closing near the bottom of its recent range |
An important point: overbought does not automatically mean “sell”. In a strong uptrend, the Williams %R indicator can stay between 0 and −20 for a long time, because price keeps closing near its highs. The same applies to oversold readings in downtrends.
Williams %R vs the Stochastic Oscillator
Williams %R is closely related to the fast stochastic oscillator. In fact, it is essentially the fast %K line plotted on an inverted scale:
| Feature | Williams %R | Stochastic oscillator |
|---|---|---|
| Scale | 0 to −100 | 0 to 100 |
| Overbought / oversold | Above −20 / below −80 | Above 80 / below 20 |
| Smoothing | Usually none (single line) | Has a %D signal line and optional smoothing |
| Speed | Very fast | Slower when smoothed |
Because the Williams %R indicator is unsmoothed, it reacts faster but is also noisier. Some traders add a short moving average of %R to reduce noise.
Best Williams %R Indicator Settings
| Period | Behaviour | Suitable for |
|---|---|---|
| 7–10 | Very fast, many signals | Scalpers and short-term traders |
| 14 | Standard default | Most traders |
| 21–28 | Smoother, fewer signals | Swing traders |
| Longer (e.g. 50+) | Tracks broader momentum | Position traders and trend filters |
Some traders also adjust the overbought and oversold thresholds, for example using −10 and −90 for fewer, stronger signals. Test any changes on your market and timeframe.
Williams %R Indicator Trading Strategies
1. Overbought and oversold reversals in ranges
- Buy: %R drops below −80 and then rises back above −80 near support.
- Sell: %R rises above −20 and then falls back below −20 near resistance.
This works best in sideways markets. In trends, it produces many counter-trend signals that fail.
2. Trend pullback strategy
This is often the most reliable way to use the indicator:
- Identify the trend using a 50 or 200-period moving average or higher-timeframe structure.
- In an uptrend, wait for %R to fall below −80 during a pullback.
- Enter long when %R rises back above −80, ideally at a support level or with a bullish candle.
- Reverse the logic in a downtrend: wait for %R above −20, then sell when it drops back below −20.
3. Momentum continuation
Larry Williams also used the indicator to identify strength. When %R pushes into the overbought zone and stays there, it can confirm strong upward momentum rather than signal a reversal. Some traders buy breakouts when %R moves above −20 in an established uptrend.
4. Failure swings
A bullish failure swing occurs when %R falls below −80, bounces, pulls back but stays above −80, then rises above its recent high. A bearish failure swing is the mirror image near −20. These patterns show momentum shifting before price fully confirms it.
5. Divergence
- Bearish divergence: Price makes a higher high, but %R makes a lower high.
- Bullish divergence: Price makes a lower low, but %R makes a higher low.
Divergence is a warning, not an entry signal. Wait for price action confirmation.

Worked Example of a Williams %R Indicator Trade
Suppose GBP/USD is in an uptrend on the 4-hour chart, with price above the 50-period EMA.
- Price pulls back to a support zone near 1.3150.
- The 14-period Williams %R falls to −88, showing an oversold reading within the uptrend.
- A bullish pin bar forms at support, and %R rises back above −80.
- The trader buys at 1.3165.
- The stop goes below the support zone at 1.3135 (30 pips of risk).
- The target is the recent swing high at 1.3230 (65 pips).
- Price rallies, %R moves into the overbought zone and the target is reached two days later.
The trade gains 65 pips on 30 pips of risk, about 2.2 times the risk. The indicator timed the entry, while the trend filter and support level provided context.
This example is illustrative and uses hypothetical prices.
Using the Williams %R Indicator Across Timeframes
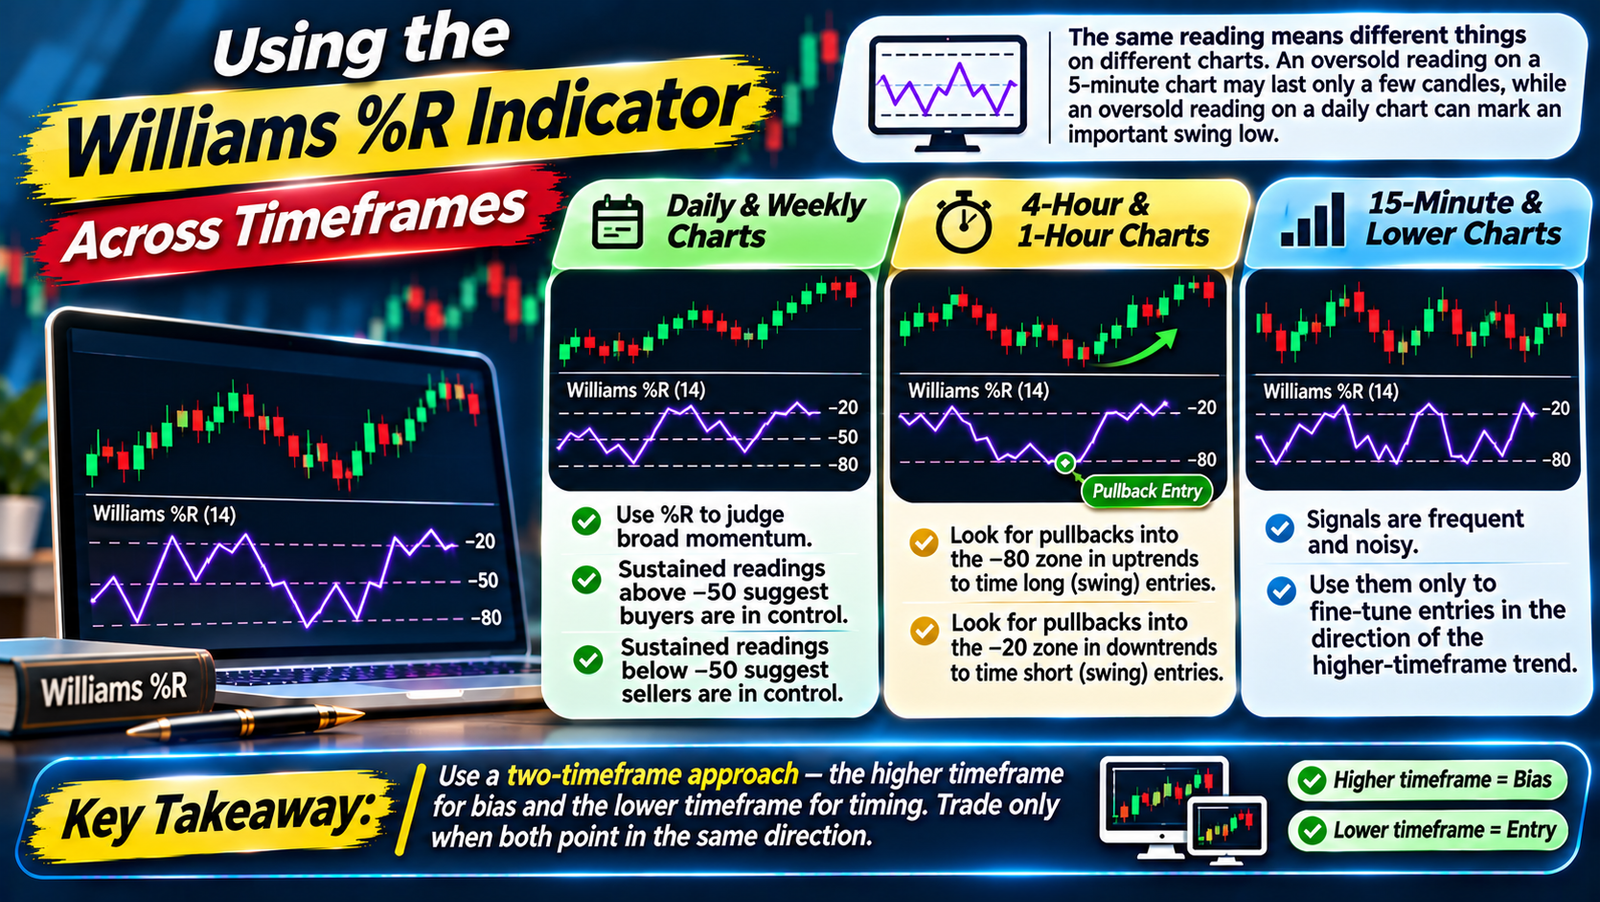
The same reading means different things on different charts. An oversold reading on a 5-minute chart may last only a few candles, while an oversold reading on a daily chart can mark an important swing low.
- Daily and weekly charts: Use %R to judge broad momentum. Sustained readings above −50 suggest buyers are in control; sustained readings below −50 suggest sellers are.
- 4-hour and 1-hour charts: Look for pullbacks into the −80 zone in uptrends, or into the −20 zone in downtrends, to time swing entries.
- 15-minute and lower: Signals are frequent and noisy, so use them only to fine-tune entries in the direction of the higher-timeframe trend.
A practical approach is to read the Williams %R indicator on two timeframes: the higher one for bias and the lower one for timing. Trade only when both point the same way.
A Simple Williams %R Trading Plan
Here is a basic, rules-based plan you can test:
- Market and timeframe: One liquid pair on the 4-hour chart.
- Trend filter: Price above the 50-period EMA for longs, below for shorts.
- Signal: %R crosses back above −80 (longs) or below −20 (shorts).
- Confirmation: A rejection candle at a support or resistance zone.
- Stop: Beyond the recent swing low or high.
- Target: The previous swing high or low, or at least twice the risk.
- Risk: No more than 1% of the account per trade.
Backtest at least 50 past signals, record every result and adjust only one rule at a time. A written plan turns the Williams %R indicator from a source of random signals into a consistent part of your process.
Combining Williams %R With Other Tools
- Moving averages: Only take signals in the direction of the 50 or 200-period moving average.
- Support and resistance: Signals at key levels are far more reliable than those in the middle of nowhere.
- Candlestick patterns: Pin bars and engulfing candles confirm turns.
- ADX: Above 25 suggests a trend, favouring pullback strategies; below 20 suggests a range, favouring reversal strategies.
- Multiple timeframes: Use a higher-timeframe trend for direction and a lower-timeframe Williams %R indicator for timing.
Limitations of the Williams %R Indicator
- Noisy: Being unsmoothed, it can flip quickly between zones.
- False signals in trends: Overbought and oversold readings can persist for long periods.
- No information on volume: It measures price position only.
- Look back dependence: Results change with the period chosen.
- Not a standalone system: Like any oscillator, it needs context and risk management.
Common Williams %R Indicator Mistakes
- Selling every overbought reading: In uptrends, this means fighting momentum.
- Ignoring the trend: Always define direction first.
- Entering as soon as a zone is reached: Wait for %R to exit the zone, or for price confirmation.
- Over-optimizing settings: Settings that look perfect on past data may fail live.
- No stop-loss: Indicators do not replace risk management.
Using the Williams %R Indicator in Indian Markets
Williams %R is available on all major Indian broker platforms and works on NSE currency futures, Nifty and Bank Nifty futures, and stocks.
- USD/INR: The pair often moves in ranges because the RBI smooths volatility, so reversal signals around −20 and −80 can work well, though moves are small. Each paise is worth ₹10 per lot.
- Cross-currency futures: EUR/USD, GBP/USD and USD/JPY futures on NSE trend more, suiting pullback strategies.
- Index futures: On strong trend days, Nifty and Bank Nifty can stay overbought or oversold for long periods, so use a trend filter.
Indian residents should trade currencies only through recognised exchanges such as NSE and BSE via SEBI-registered brokers. Leveraged forex trading on offshore platforms is not permitted under FEMA.
Williams %R Indicator Checklist
- What is the higher-timeframe trend?
- Am I using a trend pullback or a range reversal strategy?
- Has %R moved into and back out of the −80 or −20 zone?
- Is price at a meaningful support or resistance level?
- Is there a confirming candlestick?
- Is the stop beyond a logical level, with at least 1:2 reward-to-risk?
FAQs
What is the Williams %R indicator?
It is a momentum oscillator that measures where the latest close sits within the recent high-low range, on a scale from 0 to −100.
What are overbought and oversold levels on Williams %R?
Readings from 0 to −20 are considered overbought, and readings from −80 to −100 are considered oversold.
What is the best setting for Williams %R?
The default is 14 periods. Shorter settings give more signals; longer settings give smoother, fewer signals.
Is Williams %R the same as the stochastic oscillator?
It is very similar to the fast stochastic %K, but plotted on an inverted scale and usually without smoothing.
Can I use the Williams %R indicator alone?
It works best combined with trend analysis, support and resistance and price action, plus strict risk management.
Conclusion
The Williams %R indicator is a fast, simple momentum tool that shows where price closed within its recent range. It highlights overbought and oversold conditions, helps time pullback entries in trends and warns of fading momentum through divergence and failure swings.
Its speed is both a strength and a weakness, so always define the trend first, wait for %R to leave extreme zones, confirm signals with price action at key levels and manage risk carefully. Test your settings and rules on historical charts and a demo account before trading live.