

Key points to china GDP AUD USD
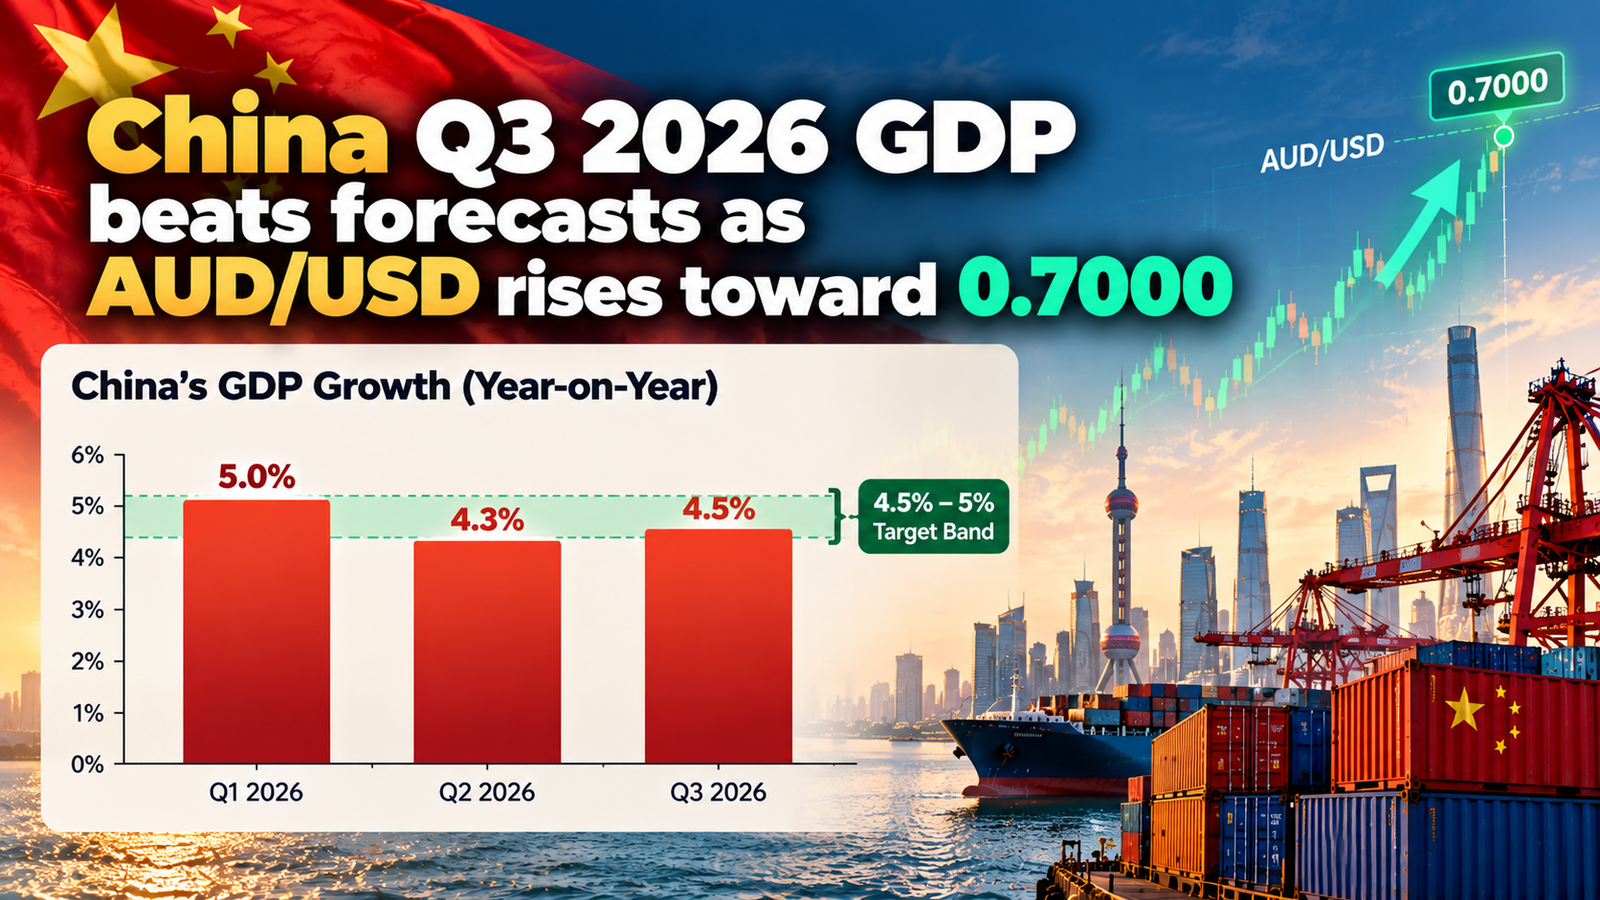
- China’s economy grew 4.5% y/y in Q3 2026, up from 4.3% in Q2.
- The consensus forecast was 4.4% y/y; quarter-on-quarter growth was 1.2% against 1.1% expected.
- AUD/USD rose for a second session to around 0.6980, up more than 0.5%, as it approached the 0.7000 mark.
- Next up: Australia’s Q3 CPI (29 Oct), the FOMC (27–28 Oct) and the RBA decision (3 Nov).
What happened
China’s National Bureau of Statistics released the data on Monday, 19 October 2026, at 02:00 GMT, which is 07:30 IST. Growth of 4.5% from a year earlier topped the 4.4% consensus and picked up from the 4.3% pace in Q2.
| China GDP (Q3 2026) | Actual | Forecast | Previous (Q2) |
|---|---|---|---|
| Year-on-year | 4.5% | 4.4% | 4.3% |
| Quarter-on-quarter | 1.2% | 1.1% | 0.9% |
For the first three quarters, the economy expanded 4.6% year on year, with output of about 107.11 trillion yuan (roughly US$15.94 trillion) for January–September. Services led growth over the nine months at 5.2%, while industry grew 3.8% and agriculture 3.7%.
The September activity data released alongside GDP was mixed. Retail sales rose 1.1% year-on-year in September and 2.6% over the first nine months. Fixed asset investment fell 7.2% year on year in the first nine months, or 4.2% excluding property. September industrial output
Why it matters
The quarter’s growth came from exports rather than domestic demand. Standard Chartered’s Hunter Chan points to robust exports and AI-related industrial demand as the support, while household consumption stayed soft. China has been held back by weak domestic demand and a sagging property market, even as technology-related exports surged during the AI boom.
The target matters for the policy outlook. Beijing set a 2026 growth target of 4.5% to 5%. Growth inside that range gives the People’s Bank of China limited urgency to cut rates, and the IMF recently trimmed its 2026 China forecast to 4.5%, citing higher energy prices linked to the Iran–US conflict. Standard Chartered kept its Q4 and full-year forecasts at 4.7% and 4.6%.
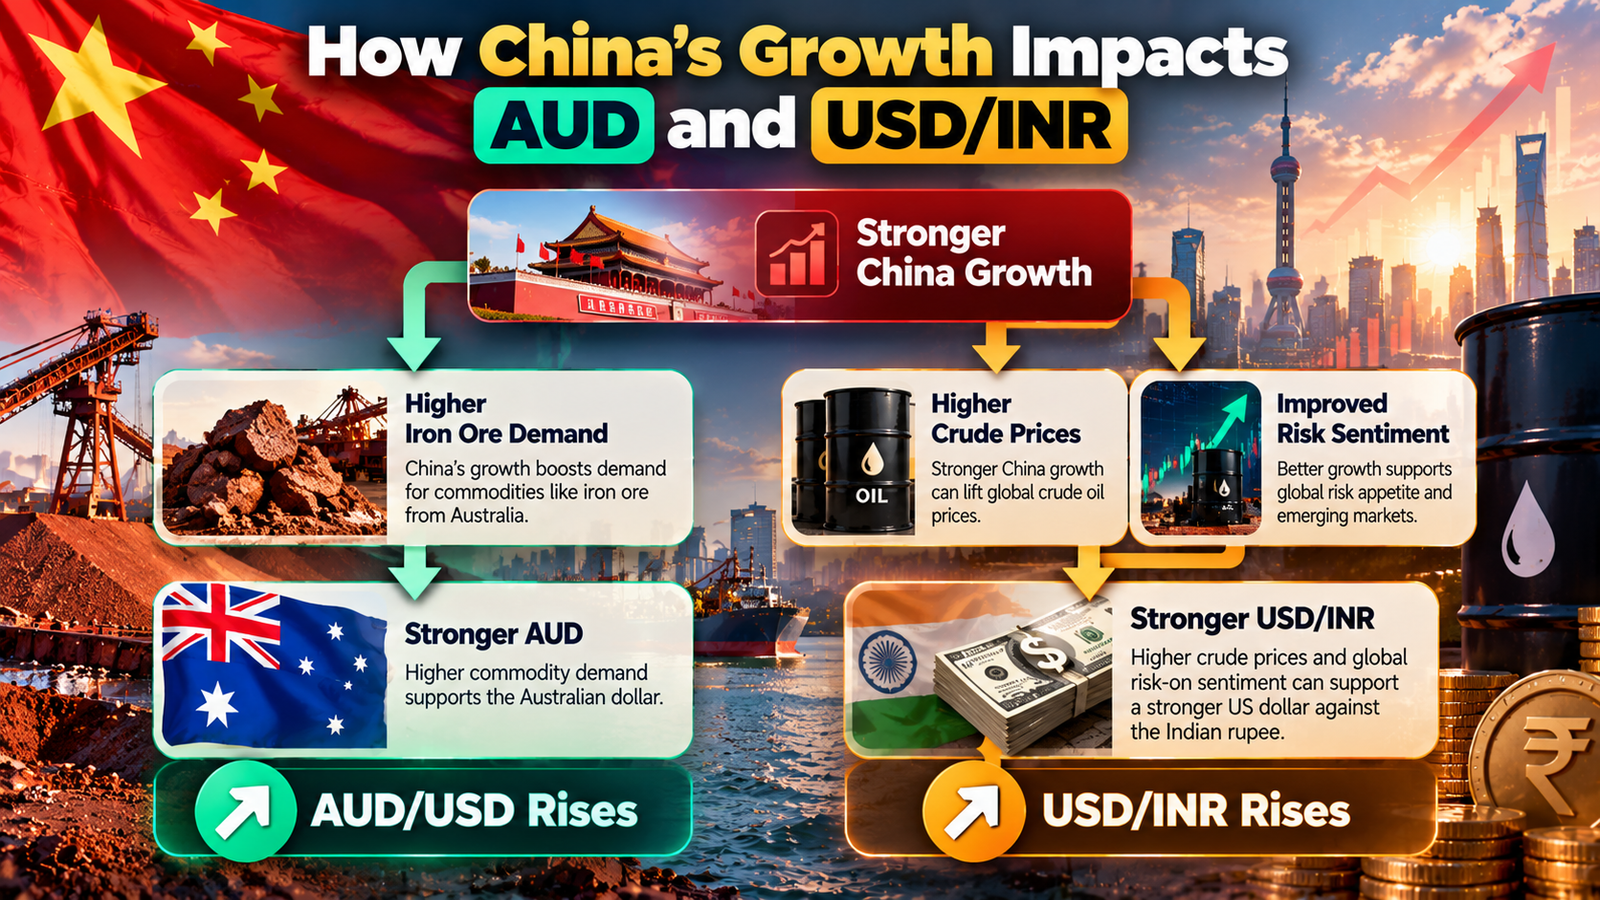
This feeds into currencies through trade links. China is Australia’s largest trading partner, so the health of the Chinese economy is a major influence on the Australian dollar. Iron ore is Australia’s largest export and China is its main buyer, so firmer iron ore prices tend to lift the AUD.
Market reaction
- AUD/USD: The pair traded around 0.6970 in Asian hours on Monday, extending its advance for a second straight session. It later reached 0.6980, up more than 0.50%, helped by improved risk appetite and the stronger GDP and retail sales data.
- Technical picture: AUD/USD remains below a cluster of the 50-, 100- and 200-day simple moving averages around 0.7079, which keeps the near-term bias bearish.
- DXY: The dollar index rose 0.19% to 101.97, so the Aussie’s gain came from AUD strength rather than broad dollar weakness.
- Gold: Gold struggled to hold above the $4,200 level.
Impact on Indian traders
AUD/USD is not available on NSE’s currency segment. Indian traders can use exchange-traded INR pairs (USD/INR, EUR/INR, GBP/INR, JPY/INR) and the cross pairs EUR/USD, GBP/USD and USD/JPY. Trading forex with unauthorised offshore platforms is not permitted under FEMA.
China data reaches these pairs indirectly:
- USD/INR: Better Chinese growth can support global risk appetite, which tends to help Asian currencies. However, it can also lift crude demand, and that is a cost for India as an oil importer. The dollar firmed on the day, so the net effect depends on DXY and crude. USD/INR level on 19–20 Oct.
- EUR/USD and GBP/USD: If the Fed is seen staying hawkish, the dollar may stay supported against the euro and pound, even with risk-on moves in Asia. Markets did not expect a Fed hike at the October meeting, but priced roughly 91% odds for December.
- Correlations: AUD/USD often moves with risk sentiment that also affects EUR/USD and Asian FX. You can check how closely these pairs have tracked each other using our Currency Correlation Calculator.
What to watch next
| Date (IST) | Event | Why it matters |
|---|---|---|
| Thu, 22 Oct | Australia S&P Global Flash PMIs (time [VERIFY]) | Tests whether the China boost reaches Australian activity |
| Wed, 28 Oct, ~23:30 | FOMC decision (meeting 27–28 October; rate at 3.75–4.00%) | A hawkish tone could cap AUD/USD and support USD/INR |
| Wed, 28 Oct | RBNZ decision | Direct driver for NZD |
| Thu, 29 Oct, ~06:00 | Australia Q3 CPI, seen as the decisive input before the RBA | Sets RBA expectations |
| Tue, 3 Nov, ~09:00 | RBA decision; the cash rate is 4.60% after a September hike | Main domestic driver for AUD |
Possible scenarios:
- If Australian CPI comes in hot and China’s momentum holds, a test of 0.7000 and then the ~0.7079 moving-average zone is likely to come into focus.
- If CPI is soft and the Fed sounds hawkish, AUD/USD may struggle to hold recent gains.
September’s soft Australian jobs data has made a further RBA hike harder to justify, which adds weight to the CPI print.
Track all release times on our Economic Calendar, and find more coverage in Market Analysis & News.
FAQs
When was China’s Q3 2026 GDP released?
On Monday, 19 October 2026, at 07:30 IST. Growth was 4.5% y/y against a 4.4% forecast.
Why does China’s GDP move AUD/USD?
China is Australia’s biggest trading partner and the main buyer of its iron ore. Stronger Chinese growth usually means firmer demand for Australian exports, which supports the AUD.
Can Indian traders trade AUD/USD on NSE?
No. NSE offers USD/INR, EUR/INR, GBP/INR and JPY/INR, plus EUR/USD, GBP/USD and USD/JPY. China data affects these pairs indirectly, through risk sentiment, the dollar and crude oil.