

Introduction
The euro is on the back foot. EUR/USD outlook is trading around 1.1220–1.1230 midweek, below its 100-day moving average and not far from a recent low near 1.1111. A hawkish Federal Reserve, US 10-year yields above 5% and fresh stress in French government bonds have all pushed the pair lower.
The week ahead is also packed with event risk. Flash PMIs land on Friday, and both central banks meet next week: the Fed on 27–28 October and the ECB on 28–29 October. That makes this EUR USD outlook as much about risk management as about direction.
In this EUR USD outlook, we cover:
- Where EUR/USD stands and what drove the recent decline
- The key EUR/USD support and resistance levels to watch
- Moving averages, RSI and Fibonacci retracement levels
- Fundamental drivers, event risk and three trade scenarios
Where EUR/USD Stands Now
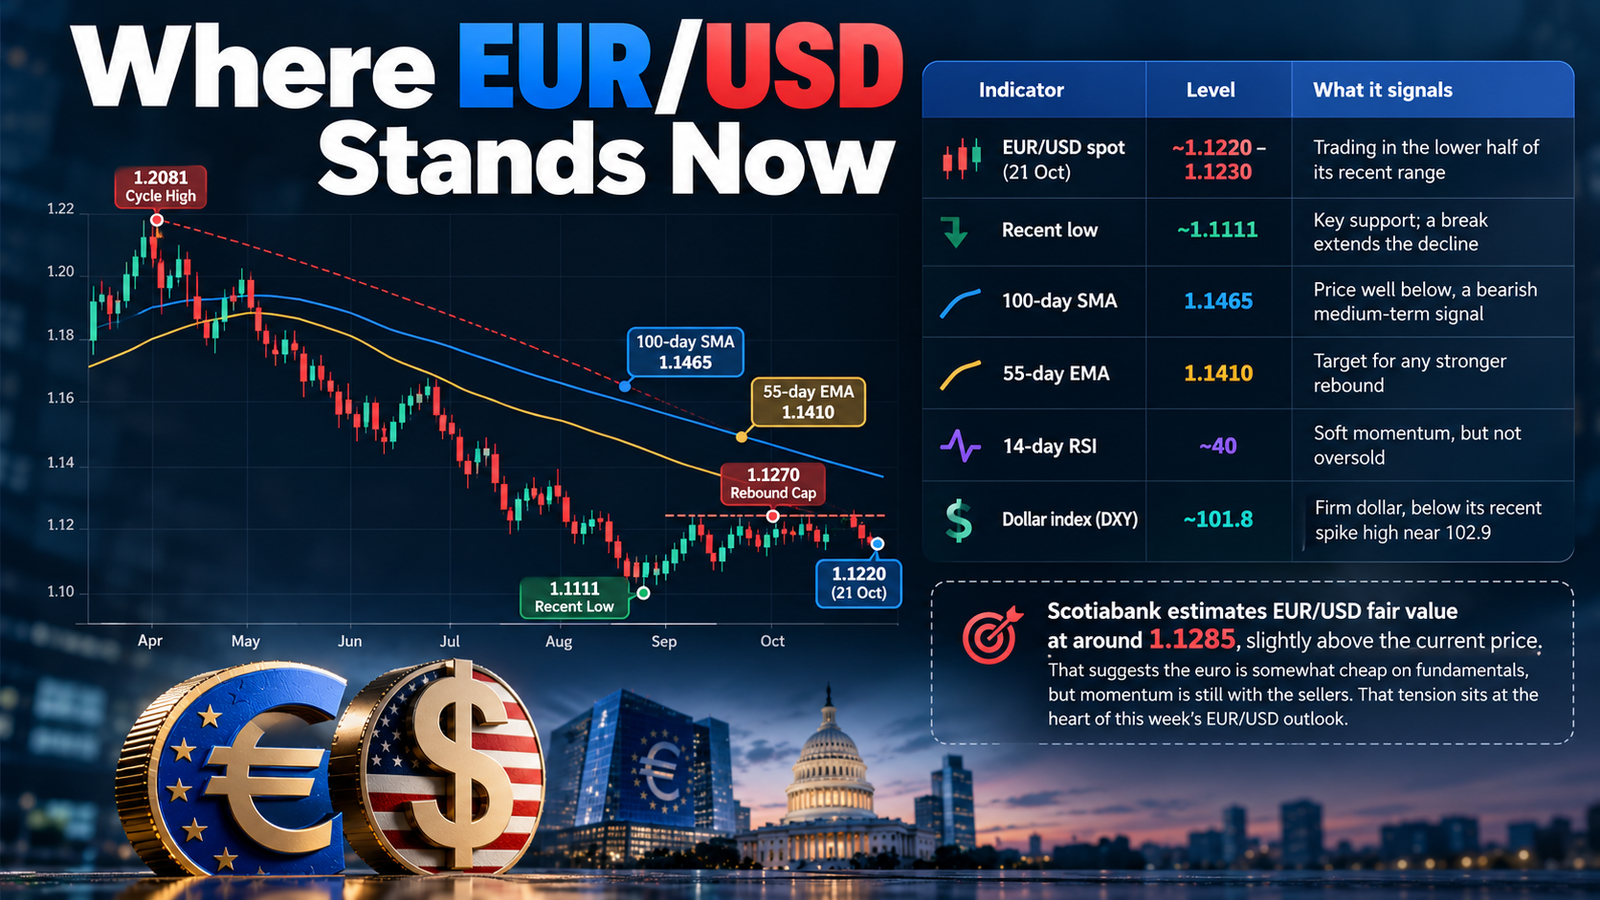
The pair has been in a downtrend since topping near 1.2081 earlier in the cycle. It dropped to about 1.1111 before staging a modest recovery, but rebounds have been capped below 1.1270. On Monday, 19 October, it slipped to around 1.1230 in early European trade, and on Wednesday it was holding near 1.1220.
| Indicator | Level | What it signals |
|---|---|---|
| EUR/USD spot (21 Oct) | ~1.1220–1.1230 | Trading in the lower half of its recent range |
| Recent low | ~1.1111 | Key support; a break extends the decline |
| 100-day SMA | 1.1465 | Price well below, a bearish medium-term signal |
| 55-day EMA | 1.1410 | Target for any stronger rebound |
| 14-day RSI | ~40 | Soft momentum, but not oversold |
| Dollar index (DXY) | ~101.8 | Firm dollar, below its recent spike high near 102.9 |
Scotiabank puts its estimate of EUR/USD fair value at around 1.1285, slightly above the current price. That suggests the euro is somewhat cheap on fundamentals, but momentum is still with the sellers. That tension sits at the heart of this week’s EUR USD outlook.
What Drove EUR/USD Lower Recently
Three forces have pushed the euro down in recent weeks. First, the Fed’s September hike and its hawkish tone lifted US yields, with the 10-year Treasury now trading above 5%. Second, US inflation stayed firm, keeping a December Fed hike firmly on the table. Third, French government bond yields climbed to their highest level since 2002, reviving worries about eurozone fiscal risk.
Rebounds have been brief. Each time EUR/USD bounced, sellers returned below 1.1270, the level that has capped the pair repeatedly this month. For this EUR USD outlook, that pattern of lower highs is the clearest sign that the short-term trend still points down.
EUR USD Outlook: Support and Resistance Levels
These are the EURUSD key levels most often cited by analysts this week:
| Type | Level | Why it matters |
|---|---|---|
| Major resistance | 1.1710 | Must hold for the medium-term downtrend to stay intact |
| Resistance | 1.1465 | 100-day simple moving average |
| Resistance | 1.1410 | 55-day exponential moving average |
| Resistance | 1.1353–1.1365 | July 28 low and prior support turned resistance |
| Key resistance | 1.1270–1.1276 | 20-day Bollinger midline, trendline and repeated rebound cap |
| Near resistance | 1.1240 | Intraday ceiling noted by several desks |
| Near support | 1.1188 | First intraday support |
| Support | 1.1151 | 15 October low |
| Key support | 1.1105–1.1111 | Recent low and lower Bollinger Band |
| Major support | 1.1050 | May 2025 low |
| Deeper target | 1.0904 | 61.8% Fibonacci retracement of the 1.0176–1.2081 rally |
The two levels that matter most in this EUR USD outlook are 1.1270 on the upside and 1.1111 on the downside. A daily close outside that band would likely set the direction for the rest of the week.
EUR/USD Technical Analysis: Indicators
Moving averages
EUR/USD trades below both its 55-day EMA at 1.1410 and its 100-day moving average at 1.1465. When price sits below these averages and they slope lower, it confirms a medium-term downtrend. Until the pair can reclaim at least 1.1410, rallies are likely to be treated as selling opportunities.
RSI and momentum
The 14-day RSI is around 40. That shows bearish momentum without being stretched, so there is still room for further declines before the pair looks oversold. On shorter charts, analysts have spotted a bullish divergence on the 4-hour MACD. That could signal a short-term bottom, but only if price breaks firmly above 1.1276.
Fibonacci retracement levels
The fall from 1.2081 is now testing whether it will retrace a large part of the earlier rally from 1.0176. The 61.8% Fibonacci retracement of that move sits at 1.0904, which some analysts see as the next major downside target if 1.1111 breaks. On the long-term chart, a 55-month EMA near 1.1246 sits right at current prices, which makes this zone even more important for the long-term EUR USD outlook.
Bollinger Bands
Price is in the lower half of its Bollinger Bands, with the middle band at 1.1270 and the lower band near 1.1105. The bands themselves line up with key resistance and support, which reinforces those levels.
The Bigger Picture: Weekly and Monthly Charts
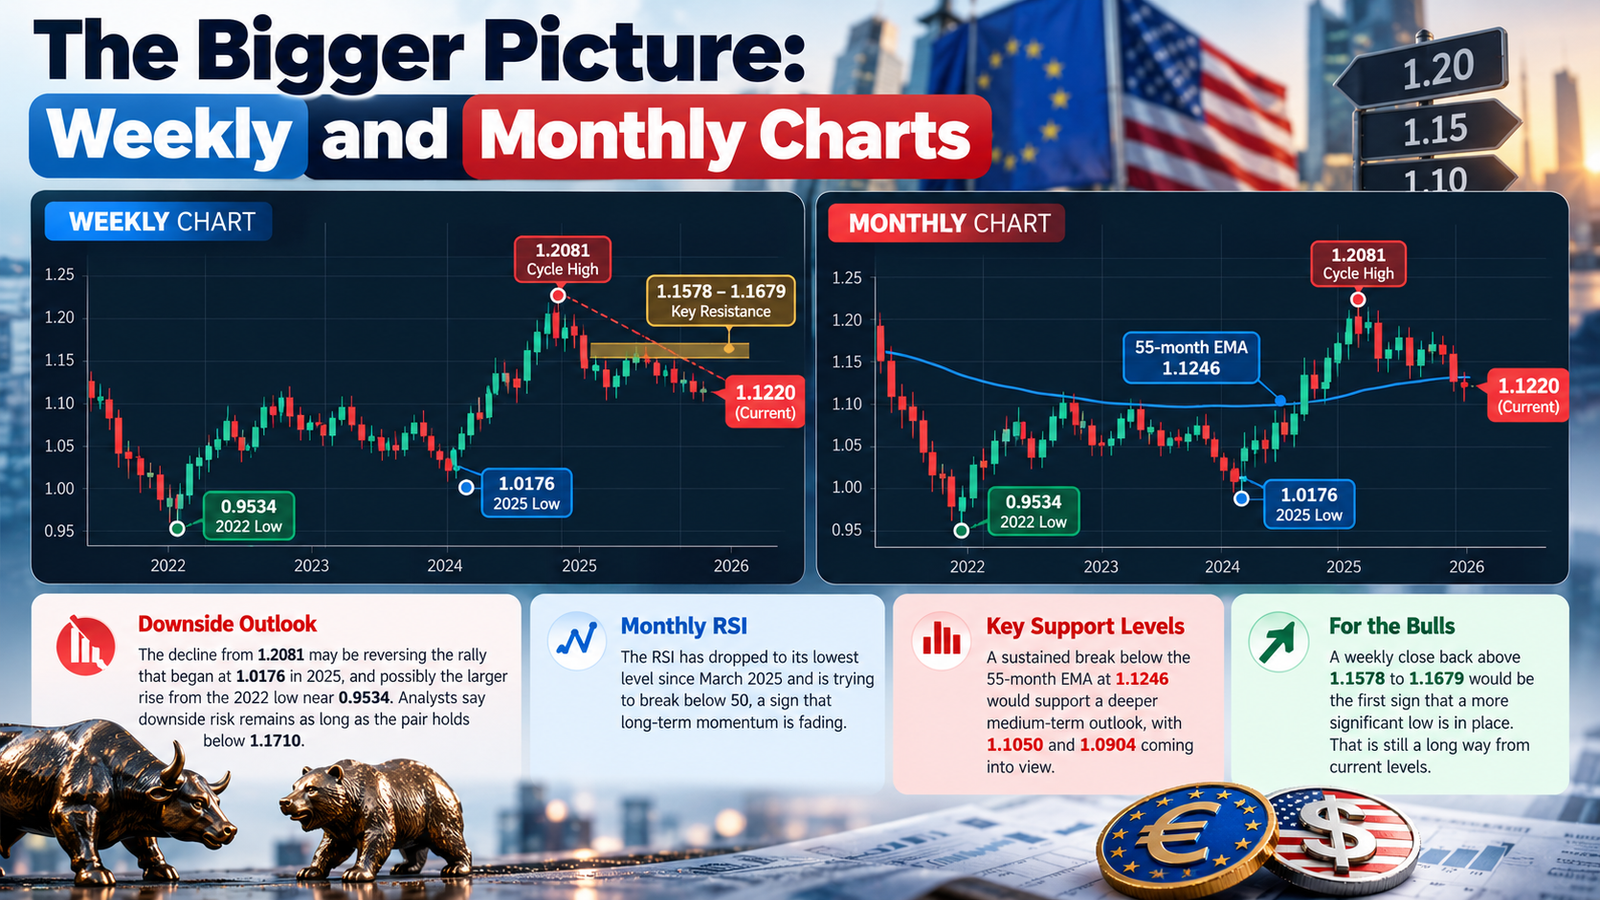
Zooming out helps put the daily moves in context. The decline from 1.2081 may be reversing the rally that began at 1.0176 in 2025, and possibly the larger rise from the 2022 low near 0.9534. Analysts say downside risk remains as long as the pair holds below 1.1710.
On the monthly chart, the RSI has dropped to its lowest level since March 2025 and is trying to break below 50, a sign that long-term momentum is fading. The 55-month EMA near 1.1246 sits almost exactly at current prices. A sustained break below it would support a deeper medium-term EUR USD outlook, with 1.1050 and 1.0904 coming into view.
For the bulls, a weekly close back above 1.1578 to 1.1679 would be the first sign that a more significant low is in place. That is still a long way from current levels.
Fundamental Drivers for the EUR USD Outlook
Fed vs ECB: the rate gap
The Fed raised rates to 3.75%–4.00% in September and remains hawkish. Markets now price a low chance of a hike at the 27–28 October meeting, around 16–17%, but see a December hike as highly likely. The ECB has raised its deposit rate twice this year to 2.50%, and a December hike to 2.75% is also largely priced in.
The gap between US and eurozone rates still favours the dollar. With the US 10-year Treasury yield above 5%, dollar assets offer more attractive returns, which draws capital away from the euro. Any shift in that rate gap will move the EUR USD outlook more than almost anything else.
French bond stress
France has become a major euro risk. Its 10-year yield neared 5% this month, the highest since 2002, and public debt is around 119% of GDP. Because France is under the EU’s excessive deficit procedure, it is not eligible for some ECB market-stabilisation tools. Protests across France, Belgium, Italy and Portugal have added to concerns about political stability.
Rising French bond yields could also make the ECB more cautious about hiking at its October meeting, which would weigh further on the euro.
Energy prices and inflation
Brent crude is trading around $110 a barrel, driven by Middle East tensions. Higher energy costs lift eurozone inflation, which was 3.3% in August, but they also hurt growth. That combination is generally negative for the euro, because Europe imports most of its energy.
US data
Not every US release has been strong. Housing starts fell 5.2% month on month, briefly pulling the dollar and yields lower. Softer US data would give the euro some room to recover.
Correlations to Watch
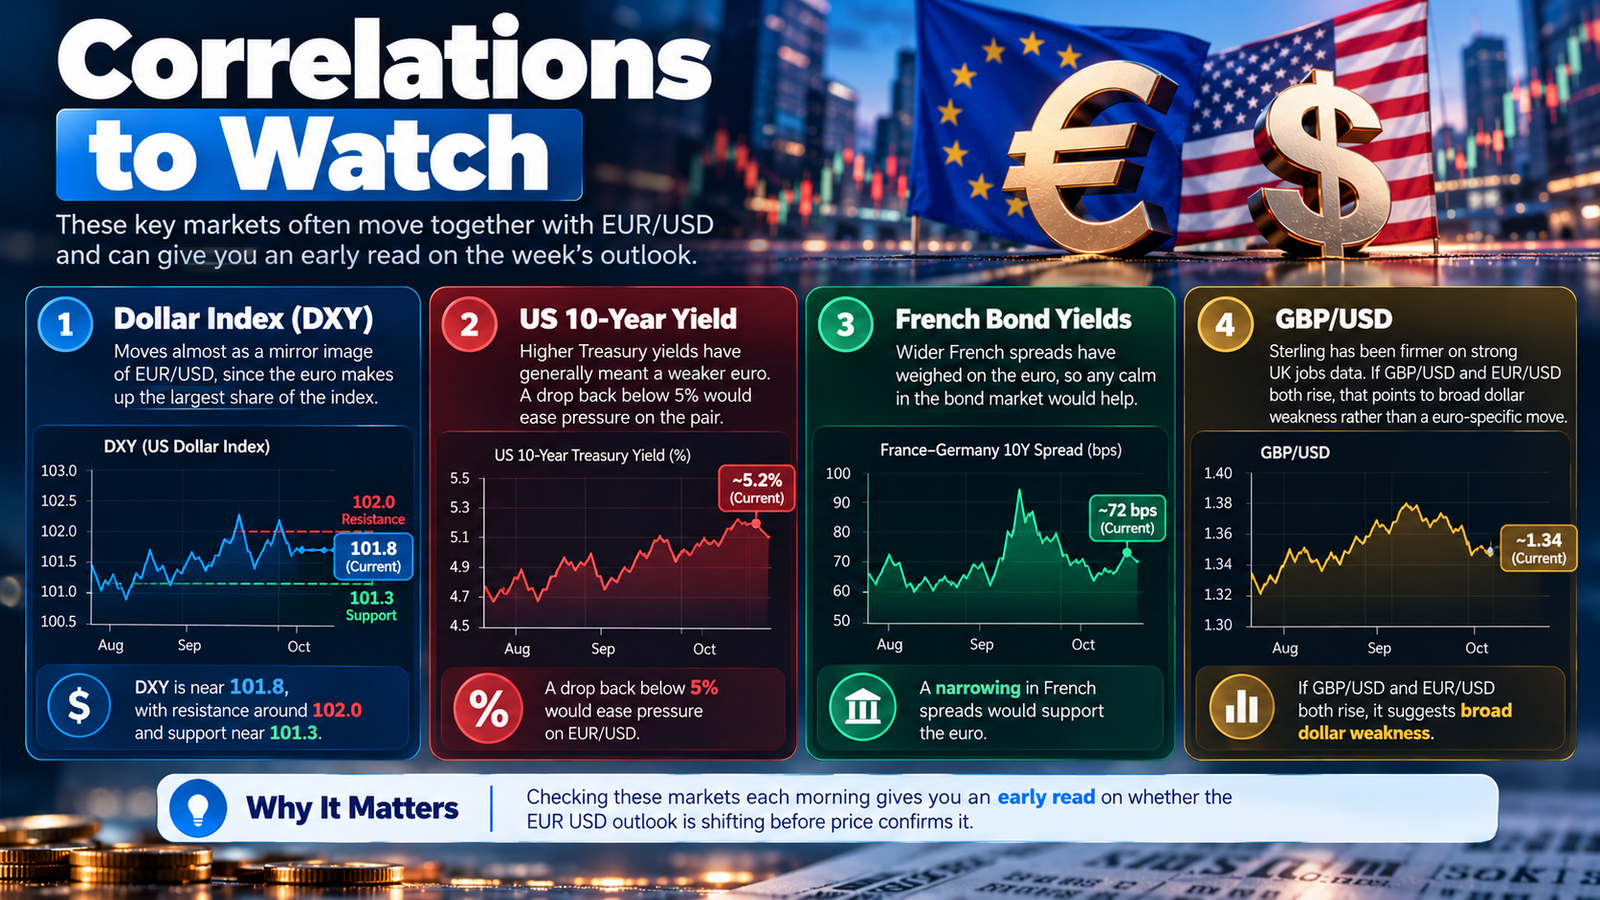
- Dollar index (DXY): EUR/USD moves almost as a mirror image of the DXY, since the euro makes up the largest share of the index. The DXY is near 101.8, with resistance around 102.0 and support near 101.3.
- US 10-year yield: Higher Treasury yields have generally meant a weaker euro. A drop back below 5% would ease pressure on the pair.
- French bond yields: Wider French spreads have weighed on the euro, so any calm in the bond market would help.
- GBP/USD: Sterling has been firmer on strong UK jobs data. If GBP/USD and EUR/USD both rise, that points to broad dollar weakness rather than a euro-specific move.
Checking these markets each morning gives you an early read on whether the EUR USD outlook is shifting before price confirms it.
Key Events This Week and Next
| Date | Event | Why it matters for EUR/USD |
|---|---|---|
| Wed 21 Oct | UK CPI, Canada CPI | Shapes broader dollar moves and risk mood |
| Thu 22 Oct | US weekly jobless claims | A strong labour market supports Fed hike bets |
| Fri 23 Oct | Eurozone and US flash PMIs | First read on October growth on both sides |
| 27–28 Oct | Fed decision | A surprise hike or hawkish tone would pressure the euro |
| 28–29 Oct | ECB decision | Any signal of a pause on hikes would weigh on EUR/USD |
With both central banks meeting next week, traders may hesitate to commit to big positions on Friday. That could keep the pair in a range until the decisions are out, an important point for this week’s EUR USD outlook.
EUR USD Outlook: Three Scenarios
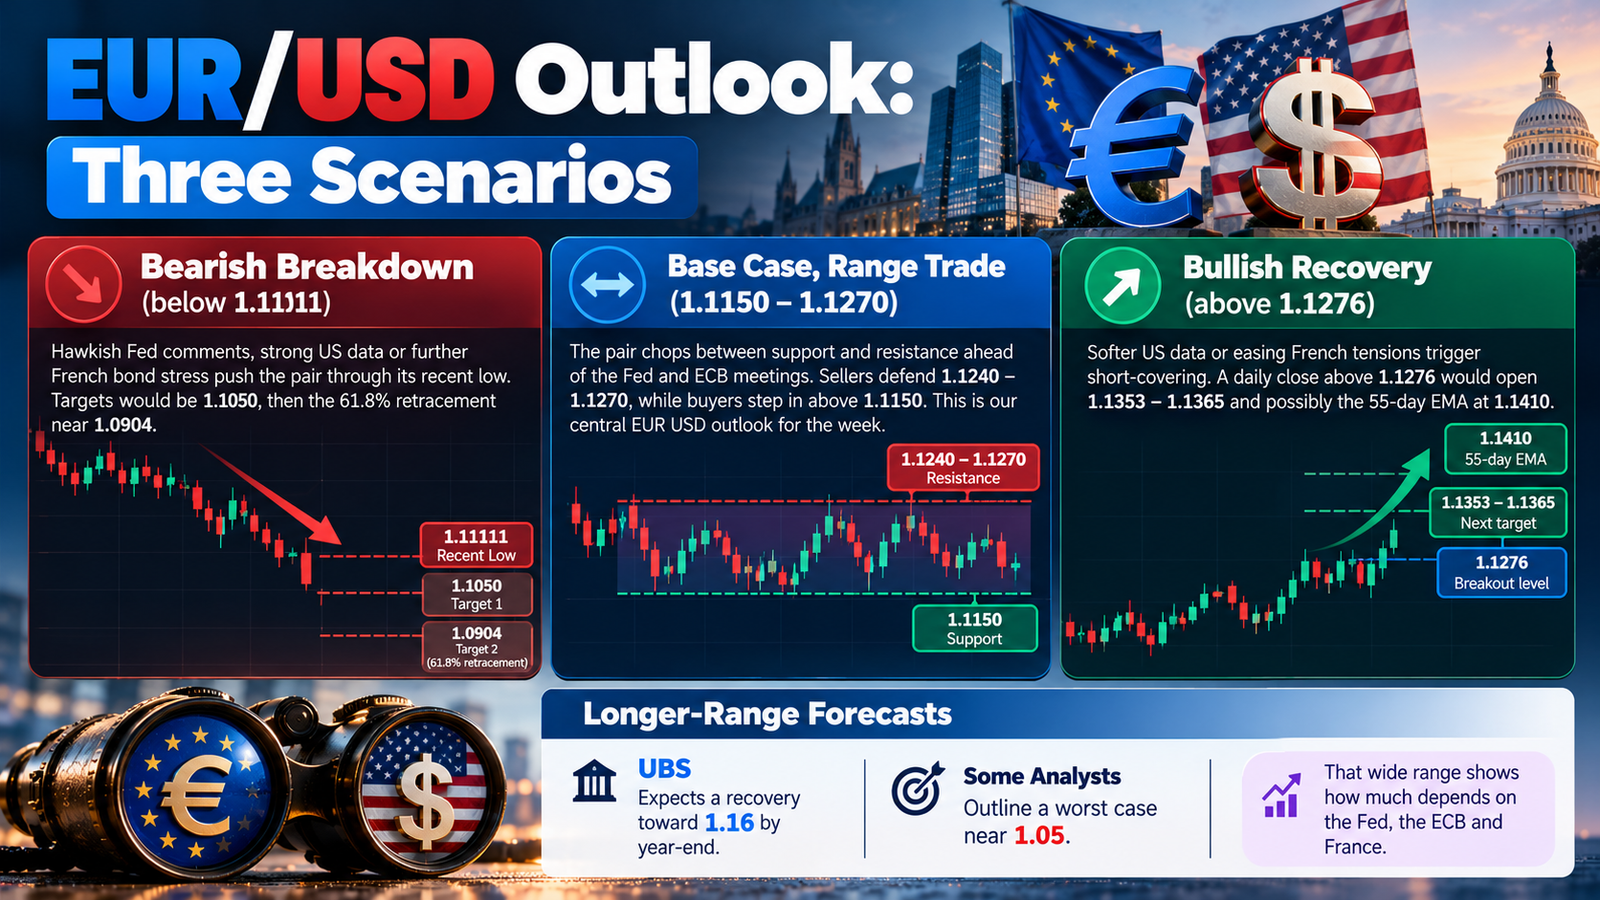
- Base case, range trade (1.1150–1.1270): The pair chops between support and resistance ahead of the Fed and ECB meetings. Sellers defend 1.1240–1.1270, while buyers step in above 1.1150. This is our central EUR USD outlook for the week.
- Bearish breakdown (below 1.1111): Hawkish Fed comments, strong US data or further French bond stress push the pair through its recent low. Targets would be 1.1050, then the 61.8% retracement near 1.0904.
- Bullish recovery (above 1.1276): Softer US data or easing French tensions trigger short-covering. A daily close above 1.1276 would open 1.1353–1.1365 and possibly the 55-day EMA at 1.1410.
Longer-range forecasts are split. UBS expects a recovery toward 1.16 by year-end, while some analysts outline a worst case near 1.05. That wide range shows how much depends on the Fed, the ECB and France.
How to Trade This EUR USD Outlook
- Range traders: Consider selling near 1.1240–1.1270 and buying near 1.1150, with tight stops beyond the range.
- Breakout traders: Wait for a daily close outside 1.1111 or 1.1276 before acting, to avoid false breaks.
- Swing traders: The medium-term trend is down while price holds below 1.1410–1.1465, so short setups on rallies align with the bigger picture.
- Everyone: Reduce position size around the flash PMIs and next week’s central bank meetings, when spreads and volatility can jump.
A clear plan matters more than a perfect forecast. Treat any EUR USD outlook, including this one, as a map of levels and risks rather than a guarantee.
FAQs
What is the EUR USD outlook for this week?
Our base case is a range of about 1.1150–1.1270 ahead of next week’s Fed and ECB meetings, with a bearish bias while the pair stays below 1.1276.
What are the key EUR/USD support levels?
1.1188, 1.1151 and the recent low near 1.1111, followed by 1.1050 and 1.0904.
What are the key EUR/USD resistance levels?
1.1240, 1.1270–1.1276, then 1.1353–1.1365, the 55-day EMA at 1.1410 and the 100-day SMA at 1.1465.
Will the EUR USD outlook change after the Fed and ECB meetings?
Very likely. A hawkish Fed or a cautious ECB would reinforce the bearish view, while a softer Fed could trigger a rebound. Expect a refreshed EUR USD outlook once both decisions are out.
Why is the euro weak against the dollar?
A hawkish Fed, US yields above 5%, French bond stress and high energy prices are all weighing on the euro.
Conclusion
EUR/USD heads into the second half of the week under pressure but close to important support. The trend is down while the pair trades below its 55-day and 100-day averages, yet the euro looks slightly cheap against its fair value estimate and momentum is not stretched.
Watch 1.1270 and 1.1111 as the key line in the sand, track Friday’s flash PMIs, and prepare for next week’s back-to-back Fed and ECB decisions. We will update our EUR USD outlook next week with fresh levels after the central bank meetings.
Disclaimer: This article is for information only and is not investment or trading advice. Forex