Quick answer: In smart money concepts (SMC), you draw a range from a recent swing low to a swing high. The midpoint is equilibrium (the 50% level). The upper half is the premium zone, where price is relatively expensive. The lower half is the discount zone, where it is relatively cheap. The rule of thumb is to look for buys in discount during an uptrend and sells in premium during a downtrend. The zones don’t predict direction; they help you avoid buying high or selling low within the current swing.
The formula:
\text{Equilibrium} = \frac{\text{Swing high} + \text{Swing low}}{2}
- Above equilibrium = premium
- Below equilibrium = discount
Example: Nifty futures swing from 24,800 to 25,200. Equilibrium = (25,200 + 24,800) ÷ 2 = 25,000. Above 25,000 is premium; below it is discount.
This guide shows how to draw the range, the Fibonacci levels traders use inside it, why entry location changes risk/reward so much, and how to combine zones with order blocks, breakers and liquidity, with worked Nifty and USD/INR examples.
How to draw premium and discount zones
Step 1: Pick the right swing
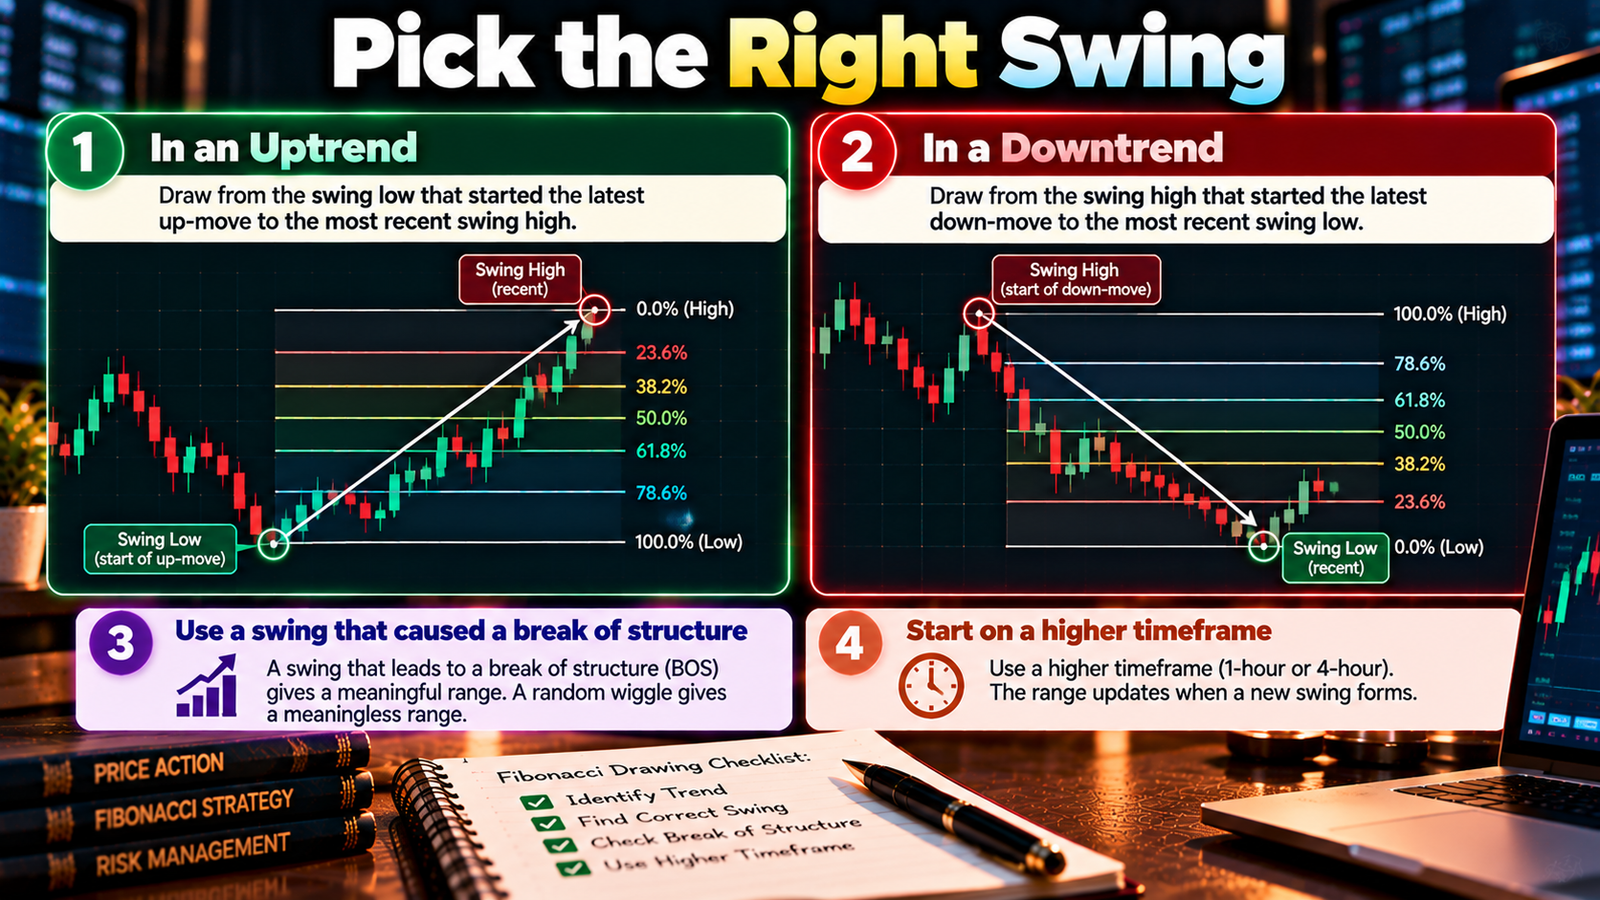
- In an uptrend: draw from the swing low that started the latest up-move to the most recent swing high.
- In a downtrend: draw from the swing high that started the latest down-move to the most recent swing low.
- Use a swing that caused a break of structure. A random wiggle gives a meaningless range.
- Start on a higher timeframe (1-hour or 4-hour); the range updates when a new swing forms.
Step 2: Mark equilibrium and key levels
Most traders use a Fibonacci tool. In SMC, the “optimal trade entry” (OTE) is commonly placed between the 62% and 79% retracement.
Worked levels: Nifty futures range 24,800 (low) to 25,200 (high), uptrend (retracement measured down from the high)
| Level | Calculation | Price | Zone |
|---|---|---|---|
| Swing high (0%) | — | 25,200 | Top of premium |
| 50% (equilibrium) | 25,200 − 0.5 × 400 | 25,000 | Midpoint |
| 61.8% | 25,200 − 0.618 × 400 | 24,952.8 | Discount (start of OTE) |
| 70.5% | 25,200 − 0.705 × 400 | 24,918.0 | Discount (middle of OTE) |
| 79% | 25,200 − 0.79 × 400 | 24,884.0 | Discount (deep OTE) |
| Swing low (100%) | — | 24,800 | Bottom of discount |
For a downtrend, the same levels are measured up from the swing low, and OTE sits in premium.
Step 3: Check the trend first
Premium and discount only make sense relative to direction. In an uptrend, discount is where you look to buy. In a downtrend, premium is where you look to sell. Buying “cheap” in a clear downtrend is just catching a falling knife.
Step 4: Update the range
When price makes a new higher high (uptrend) or lower low (downtrend), redraw the range from the new swing. Old ranges lose relevance.
Why entry location matters: the risk/reward maths
Using the Nifty range above, suppose the idea is wrong if price falls below the range low. Put the stop at 24,780 (20 points below 24,800) and the target at the swing high, 25,200.
| Entry | Zone | Risk (points) | Reward (points) | Risk/reward | Risk per lot (× 65) | Win rate needed to break even |
|---|---|---|---|---|---|---|
| 25,100 | Premium | 320 | 100 | 1 : 0.31 | ₹20,800 | 76.2% |
| 25,000 | Equilibrium | 220 | 200 | 1 : 0.91 | ₹14,300 | 52.4% |
| 24,953 | 61.8% (discount) | 173 | 247 | 1 : 1.43 | ₹11,245 | 41.2% |
| 24,916 | about 70.5% (discount) | 136 | 284 | 1 : 2.09 | ₹8,840 | 32.4% |
Break-even win rate = 1 ÷ (1 + reward/risk), before charges.
What this shows: the same trade idea, with the same stop and target, goes from needing a 76% win rate (buying in premium) to about 32% (buying deep in discount). That is the real value of premium and discount zones. They are a disciplined way to demand a better price, not a crystal ball.
The trade-off: deeper entries fill less often. Price may never pull back to 70.5% and simply continue higher. Missing a trade is the cost of better risk/reward, which is the same logic as the no-chase rule in the FOMO guide.
Combining zones with order blocks, breakers and liquidity
Premium and discount tell you where in the range price is. Other SMC tools tell you what is at that price. The strongest setups line up several of them.
| Confluence | In an uptrend (buy setups) | In a downtrend (sell setups) |
|---|---|---|
| Zone | Discount, ideally the 62–79% OTE area | Premium, ideally the 62–79% OTE area |
| Order block or breaker | A bullish order block or bullish breaker inside discount | A bearish order block or bearish breaker inside premium |
| Liquidity | A sweep of sell-side liquidity (e.g., equal lows) just before | A sweep of buy-side liquidity (e.g., equal highs) just before |
| Target | Buy-side liquidity above the range high | Sell-side liquidity below the range low |
Example 1: Nifty futures, buy in discount (illustrative)
- Uptrend range: 24,800 to 25,200. Equilibrium 25,000.
- A bullish order block sits at 24,905–24,925, inside the OTE area (61.8% = 24,952.8, 79% = 24,884).
- Price sweeps a minor low at 24,930 and returns into the order block.
- Entry: 24,916. Stop: 24,780 (below the range low with a buffer). Target: 25,200 (range high, where buy-side liquidity sits).
| Item | Value |
|---|---|
| Risk / reward | 136 : 284 points, about 1 : 2.1 |
| Risk per lot | ₹8,840 |
| Lots at 1% of ₹10 lakh (₹10,000) | 1 |
| Lots at 1% of ₹5 lakh (₹5,000) | 0: the trade doesn’t fit; skip it |
This shows a common reality: a logical stop on Nifty can exceed a small account’s risk budget, even at one lot. The answer is to skip the trade or use a smaller instrument, not to shrink the stop.
Example 2: USD/INR futures, sell in premium (illustrative)
An exporter with dollar receivables (a genuine exposure) wants to hedge by selling USD/INR futures.
- Downtrend range, measured from the swing high of ₹95.96 down to the swing low of ₹95.40. Equilibrium = ₹95.68.
- Premium OTE levels: 61.8% ≈ ₹95.7450, 70.5% ≈ ₹95.7950, 79% ≈ ₹95.8425 (rounded to the ₹0.0025 tick).
- A bearish breaker sits near ₹95.83–₹95.85. Price sweeps buy-side liquidity above a minor high and rejects.
- Entry: short at ₹95.8425. Stop: ₹95.99 (above the range high). Target: ₹95.40 (range low).
| Item | Value |
|---|---|
| Risk | ₹0.1475 (59 ticks) = ₹147.50 per lot |
| Reward | ₹0.4425 = ₹442.50 per lot |
| Risk / reward | 1 : 3.0 |
| Lots at ₹2,000 risk | 2,000 ÷ 147.50 = 13.56, so 13 lots (₹1,917.50 at risk) |
Rupee-linked currency derivatives are for hedging a genuine exposure under RBI rules. These examples show the mechanics; they are not recommendations.
What the evidence says
What holds up
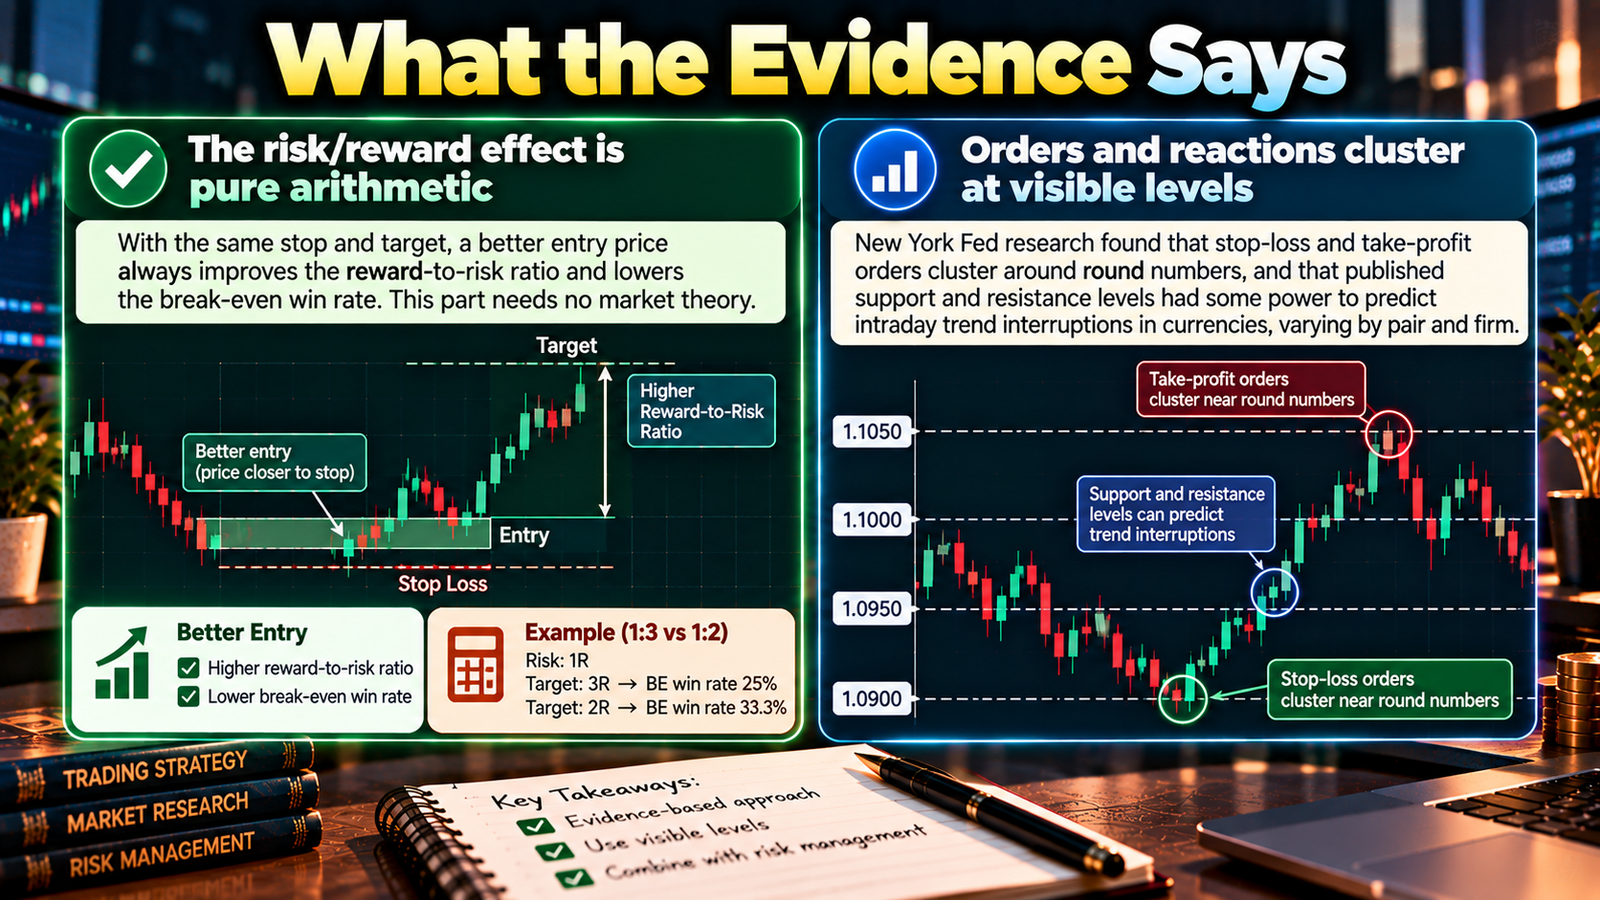
- The risk/reward effect is pure arithmetic. With the same stop and target, a better entry price always improves the reward-to-risk ratio and lowers the break-even win rate. This part needs no market theory.
- Orders and reactions cluster at visible levels. New York Fed research found that stop-loss and take-profit orders cluster around round numbers, and that published support and resistance levels had some power to predict intraday trend interruptions in currencies, varying by pair and firm.
What is not established
- There is no peer-reviewed evidence that the 50% level, or the 62–79% OTE band, has special predictive power in markets.
- Fibonacci ratios are widely used, but academic support for them as turning points is weak. Their popularity may make them self-fulfilling at times, but that is not the same as a reliable edge.
- Claims that “institutions” buy in discount and sell in premium are interpretations, not documented facts.
A fair reading
Premium and discount zones are best seen as a price-discipline rule rather than a forecasting tool. They stop you from buying after a big run-up or selling after a big drop within the current swing. Whether a specific rule set built on them is profitable after costs is something you have to test yourself on past charts, including all the setups that failed.
Expert analysis
Fact: with a fixed stop and target, moving entry from the premium to deep discount in the Nifty example cuts the break-even win rate from 76.2% to 32.4%.
Fact: New York Fed research found orders cluster around round numbers and that support and resistance levels had some intraday predictive power in currencies. There is no comparable peer-reviewed evidence for the 50% or OTE levels specifically.
Analysis: the main benefit of premium and discount is behavioural. It forces patience and a better entry price, which is exactly what FOMO destroys. Traders who use the zones as a filter, not a signal, get the arithmetic benefit without relying on unproven claims.
Analysis: the zones are only as good as the range you draw. Picking a different swing high or low changes equilibrium completely. Written rules for choosing swings (e.g., only swings that broke structure, on the 1-hour chart) make the method consistent and testable.
Opinion: for beginners, premium and discount are one of the more useful SMC ideas, because the core benefit is simple maths. Combine them with trend, fixed risk and a willingness to miss trades.
Common mistakes
- Drawing the range from an arbitrary swing that didn’t break structure.
- Buying in discount during a clear downtrend.
- Treating equilibrium as a guaranteed reversal level.
- Tightening the stop to make a deep-discount trade fit a small account.
- Redrawing the range after the fact to make a losing trade “fit.”
- Ignoring scheduled news that can blow through any zone.
Myths vs facts
| Myth | Fact |
|---|---|
| Price always returns to equilibrium | Strong trends often don’t retrace to 50% |
| The 62–79% OTE band is a proven reversal zone | No peer-reviewed evidence shows this |
| Buying in discount means the trade will win | It improves risk/reward; it doesn’t change direction |
| Institutions only buy in discount | That’s an interpretation, not a documented fact |
| Premium and discount work on any random swing | They depend on choosing a meaningful range |
Key takeaways
- Equilibrium = (swing high + swing low) ÷ 2. Above is premium; below is discount.
- In uptrends, look for buys in discount; in downtrends, look for sells in premium.
- The OTE area is commonly placed at the 62–79% retracement.
- With the same stop and target, better entry location cuts the win rate needed to break even (76.2% down to 32.4% in the Nifty example).
- Combine zones with trend, order blocks or breakers, and a prior liquidity sweep.
- Deeper entries fill less often, and missing trades is part of the method.
- Treat the zones as price discipline, not prediction.
FAQs
1. What are premium and discount zones in SMC?
They are the upper and lower halves of a price range between a swing low and a swing high. Premium is above the 50% midpoint; discount is below it.
2. How do you calculate equilibrium?
Equilibrium = (swing high + swing low) ÷ 2. For a Nifty range from 24,800 to 25,200, it is 25,000.
3. Should I buy in discount?
In an uptrend, looking for buys in discount improves risk/reward. In a downtrend, buying in discount can mean catching a falling market.
4. What is OTE in ICT and SMC?
Optimal trade entry is commonly placed between the 62% and 79% Fibonacci retracement of the range, inside discount for buys or premium for sells.
5. Which swing high and low should I use?
Use the swing that started the latest move and the most recent swing in that direction, ideally one that broke market structure, on a higher timeframe such as 1-hour or 4-hour.
6. Do premium and discount zones predict reversals?
No. They show where price sits within a range. Their main benefit is better risk/reward, not prediction.
7. Why does entry location matter so much?
With the same stop and target, a better entry reduces risk and increases reward. In the Nifty example, the break-even win rate falls from 76.2% in premium to 32.4% deep in discount.
8. What is equilibrium in trading?
It is the 50% level of the current range: the midpoint between the swing high and swing low.
9. Can I use premium and discount zones on Nifty?
Yes, the calculation works on any chart. Check that the stop fits your risk budget; one Nifty lot can exceed a small account’s limit.
10. Can I use premium and discount zones on USD/INR?
Yes. Round levels to the ₹0.0025 tick. RBI rules require a genuine underlying exposure for rupee currency derivatives.
11. How do premium and discount relate to order blocks?
Many traders look for bullish order blocks inside discount and bearish order blocks inside premium, combining location with a specific zone.
12. What if price never reaches discount?
Then you miss the trade. That’s the cost of demanding a better price, and it’s usually better than chasing an entry in premium.
13. Is Fibonacci proven to work?
Fibonacci levels are widely used, but academic evidence for them as reliable turning points is weak.
14. How often should I redraw the range?
Whenever price makes a new swing high in an uptrend or a new swing low in a downtrend.
15. How many lots should I trade in a discount setup?
Divide your rupee risk by the risk per lot from entry to stop, and round down. If it’s less than one lot, skip the trade.
16. Are premium and discount zones good for beginners?
They can be, because their main benefit is simple maths. Use them as a filter with trend, fixed risk and tested rules, not as standalone signals.