Gold Volatility Fast Facts
- XAUUSD surged over 27% in just two weeks during a recent geopolitical shock — making it one of the fastest sustained rallies in gold trading history
- Gold crossed $5,000/oz for the first time ever, driven by a combination of tariff wars, Federal Reserve policy uncertainty, and aggressive safe-haven demand
- XAUUSD can move 500+ pips in a single session — a $5 move in gold price equals 500 pips, making gold price volatility among the highest of any traded asset
- Global gold demand exceeded 5,000 tonnes in a recent full year — an all-time record — with total central bank gold buying reaching 863 tonnes annually (Source: World Gold Council)
- 95% of central banks surveyed expect global gold reserves to increase — the most bullish reading in the survey’s history (Source: World Gold Council)
- A 10% flash crash in XAUUSD in a single post-FOMC session was followed by a full recovery within days — illustrating why stop-loss placement in gold is non-negotiable
Why Gold Volatility Is Extreme — And Why Most Traders Get Wrecked
If you’ve been watching XAUUSD lately, you already know — gold price volatility is unlike anything most retail traders have experienced. Gold has shattered expectations, with XAU/USD surging well past the $5,000 per ounce mark — driven by a volatile cocktail of geopolitical tensions, shifting Federal Reserve monetary policy, and aggressive central bank gold buying.
The problem? Most traders are still using the same fixed strategies they learned in 2020. Tight 20-pip stops. Random entries on breakouts. No adjustment for volatility. In a market that can move 300+ pips in 30 minutes, that approach doesn’t just underperform — it destroys accounts.
This guide will teach you exactly how to trade gold during high volatility the right way: with a structured 3-rule entry system, ATR-based stop losses, proper position sizing for XAUUSD, and timing strategies built for Indian traders using IST. Whether you’re a beginner or an intermediate trader, this is the framework that replaces guesswork with process.
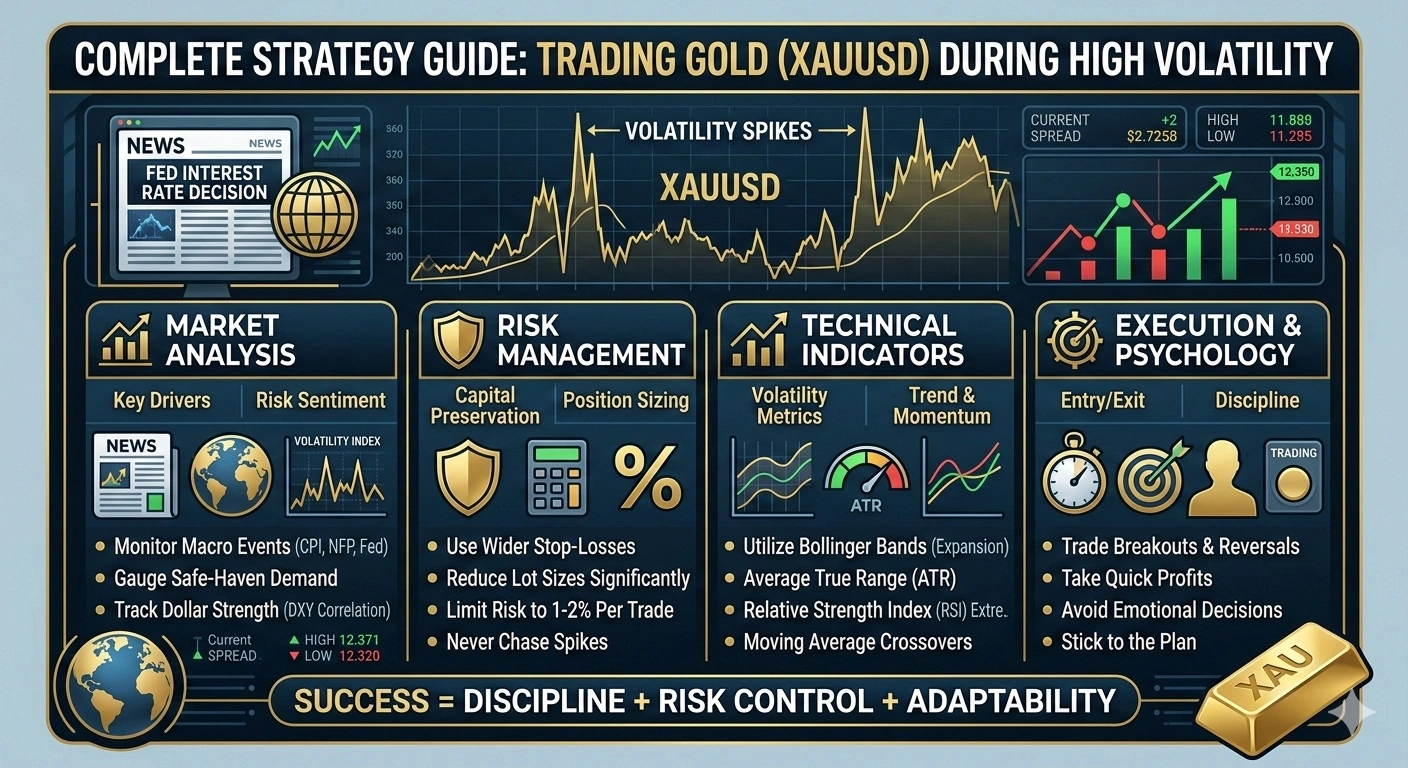
Understanding Gold Volatility — What Causes It and How to Measure It
What Is Gold Volatility?
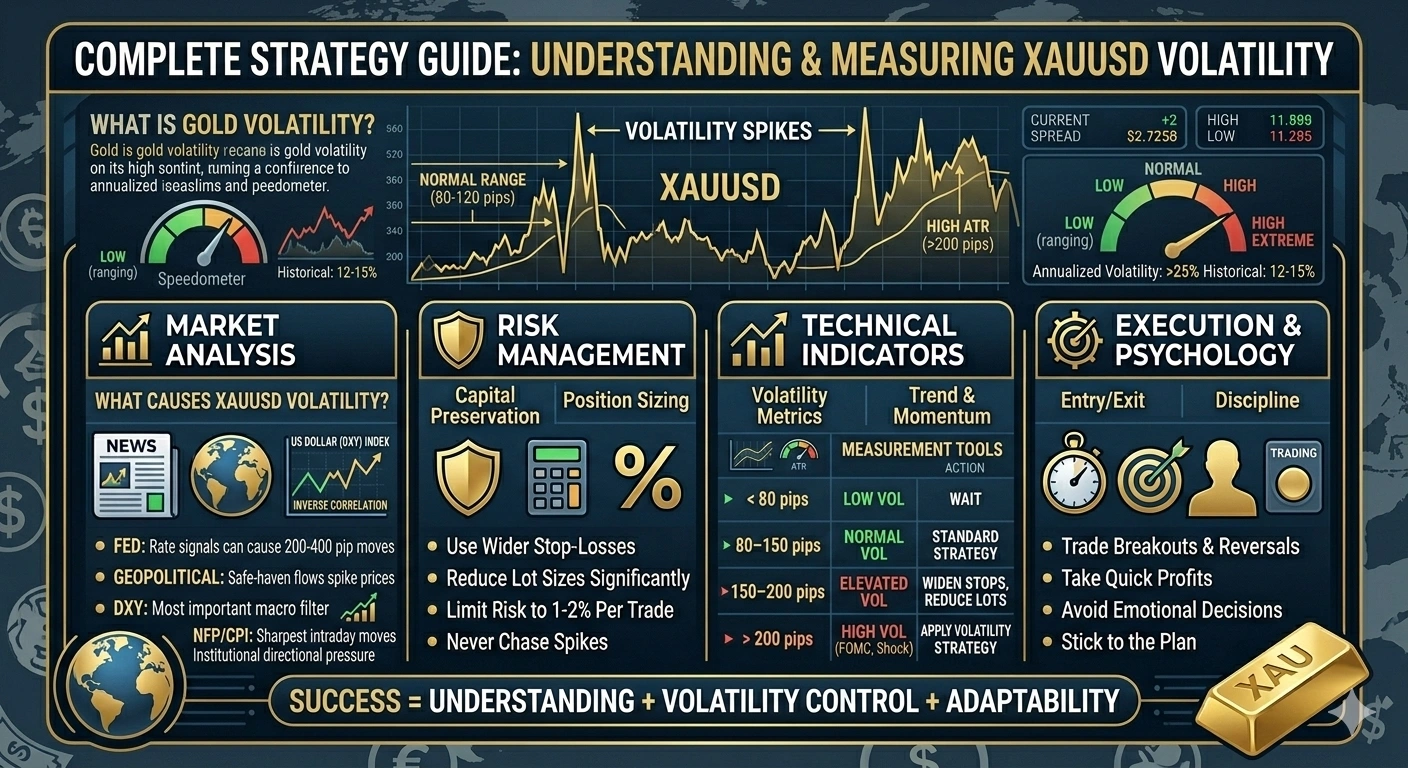
Gold price volatility refers to the speed and magnitude at which XAU/USD (spot gold) prices fluctuate within a given period. It is measured statistically using the Average True Range (ATR), Bollinger Band width, and implied volatility from gold options markets. High XAUUSD volatility means larger price swings in shorter time frames — creating both greater profit potential and greater risk. Gold’s annualized volatility has recently exceeded 25%, compared to a historical average of 12–15%.
What Causes XAUUSD Volatility?
Gold price volatility doesn’t come from nowhere. It’s driven by a specific set of catalysts. As a trader, your edge comes from knowing these triggers before they hit:
- Federal Reserve interest rate decisions — The single biggest mover. When the Fed signals rate changes, gold can move 200–400 pips within hours. Higher interest rates strengthen the dollar, pressuring gold lower. Rate cuts do the opposite.
- Geopolitical risk events — Wars, sanctions, and political instability push institutional money into gold as a safe haven asset, spiking prices rapidly.
- US Dollar Index (DXY) movements — Gold and the dollar share a strong inverse correlation. When the DXY rises, XAUUSD typically falls, and vice versa. This is your most important macro filter.
- Non-Farm Payrolls (NFP) and CPI data — These US economic releases trigger some of the sharpest intraday gold moves of any month.
- Central bank gold purchases — Institutional buying from central banks creates sustained directional pressure that retail traders often fight against.
Normal XAUUSD daily range sits between 80–120 pips. High volatility is when the Average True Range (ATR) on the daily chart exceeds 150 pips. Extreme volatility — like during major FOMC weeks and geopolitical shock events — pushes ATR above 200–250 pips.
ATR Values to Watch (Specific Numbers)
| ATR Value (Daily) | Market Condition | Your Action |
|---|---|---|
| < 80 pips | Low volatility / ranging | Wait — setups are unreliable |
| 80–150 pips | Normal volatility | Standard strategy, normal stop sizes |
| 150–200 pips | Elevated volatility | Widen stops, reduce lot size |
| > 200 pips | High volatility (FOMC weeks, geopolitical shock) | Apply the strategy in this guide — or stay out |
Best Volatility Indicators for Gold
- Average True Range (ATR) — Set to 14 periods on the daily or H4 chart. This is your primary gold volatility indicator.
- Bollinger Bands — Bands expanding rapidly = high volatility. Bands squeezing = low volatility / breakout incoming.
- VIX (Volatility Index) — When the VIX spikes above 25, expect gold to react strongly as risk-off sentiment takes over.
- Volume indicators — Rising volume during a price move confirms the move is real, not a fake-out.
Gold Seasonal Volatility Patterns
Historical data since 1975 shows gold prices follow a seasonal cycle: the highest average prices occur in January and September, while March historically sees the lowest prices. This means gold volatility is structurally elevated in Q1 and Q3 every year — not just during macro events. For traders, this seasonal context helps explain why XAUUSD ranging periods in Q2 and Q4 often produce fewer reliable setups.
Best Times to Trade Gold During Volatility (IST Timings Included)
Gold (XAU/USD) volatility isn’t the same all day. Data shows strong moves around 8 AM New York time, often linked to US economic news, with extra momentum at the COMEX open. London sessions bring steady activity, while Asian hours are generally calmer.
Gold Trading Session Times (IST for Indian Traders)
| Session | IST Timing | Volatility Level | Best For |
|---|---|---|---|
| Asian Session | 5:00 AM – 1:30 PM IST | Low–Medium | Swing setups, not intraday scalping |
| London Session Open | 1:30 PM – 4:00 PM IST | High | Structure breaks, trend initiation |
| London–New York Overlap | 6:30 PM – 10:30 PM IST | Highest ⚡ | Best time for volatile gold trading |
| NY Close | 10:30 PM – 12:00 AM IST | Declining | Exit positions, avoid new entries |
When NOT to Trade Gold
This is as important as knowing when to trade. Avoid XAUUSD during high volatility in these windows:
- First 30 minutes after major news (NFP, CPI, FOMC) — The spread widens, stops get hunted, and the direction reverses multiple times. Even professional traders sit on their hands.
- Pre-FOMC (Federal Open Market Committee) meetings — Markets price in expectations. Price action becomes erratic 24–48 hours before announcements.
- Holiday periods — Low liquidity means any large order causes outsized moves with no follow-through.
- Sunday market open (IST: ~7:30 PM) — Gap risk is high and liquidity is thin.
3-Rule Entry Strategy for Volatile Gold Markets
The biggest mistake traders make during high volatility gold trading is chasing price. Gold moves fast, and the emotional pull to jump in after a 100-pip candle is overwhelming. Resist it.
Use These Timeframes (Not 5-Min During Chaos)
During high volatility, your gold trading timeframe should be:
- 1H chart — For identifying the overall structure and key levels
- 15-min chart — For entry timing and candle confirmation
- Avoid the 5-minute chart — Too much noise during volatile sessions causes premature exits and false signals
Multi-Timeframe Analysis (MTF) for XAUUSD During High Volatility
Multi-timeframe analysis is the process of reading gold price action across multiple chart timeframes simultaneously to align your trade direction with the dominant trend. Here’s the exact hierarchy for volatile gold markets:
| Timeframe | Purpose | What to Look For |
|---|---|---|
| Daily chart | Market bias | Is price above or below the 20-day MA? Is the trend up or down? |
| 4H chart | Key S/R levels | Mark swing highs, swing lows, and order blocks |
| 1H chart | Structure & setup | Identify the break of structure (BOS) |
| 15-min chart | Entry timing | Wait for rejection candle at retest |
Never take a 15-min short when the daily chart shows a strong uptrend. Top-down analysis filters out 60–70% of losing setups before you ever look at an entry.
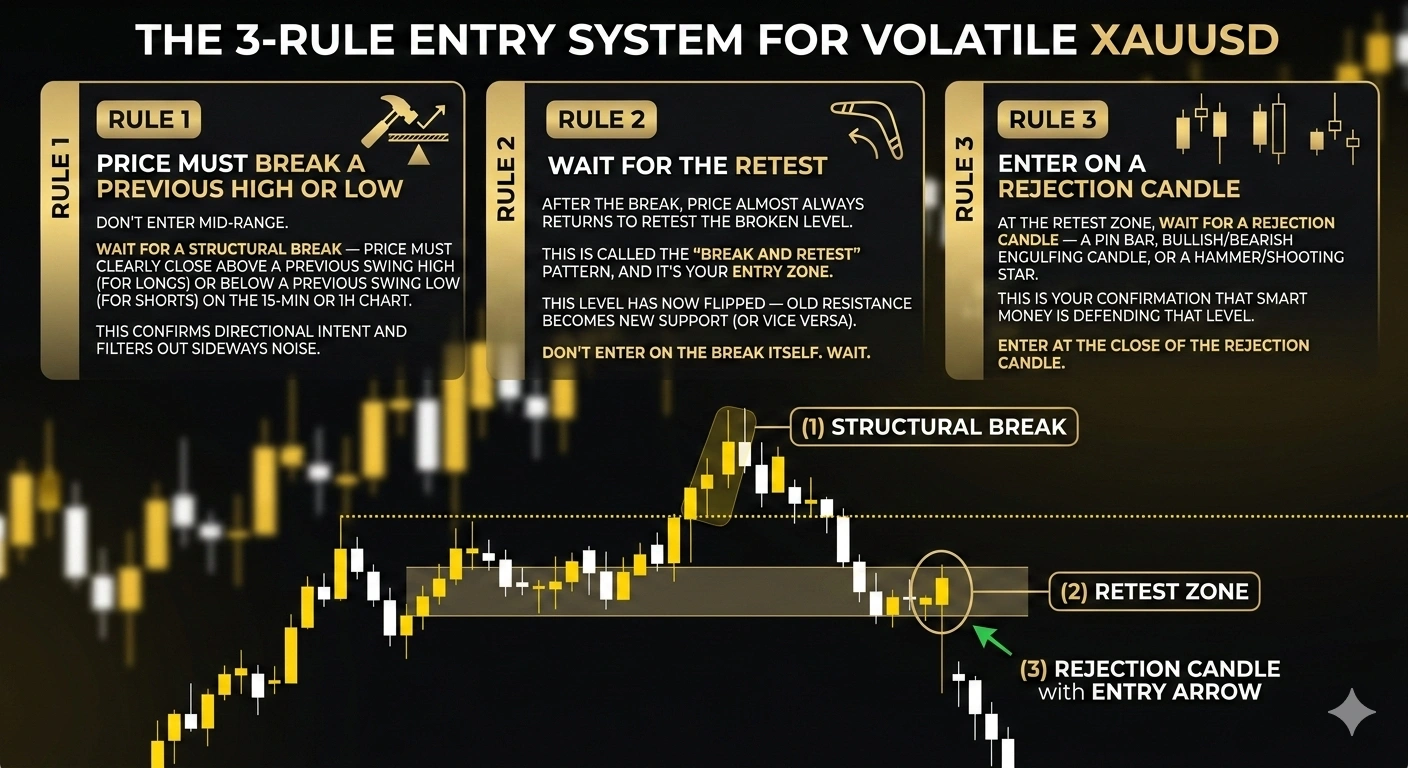
The 3-Rule Entry System for Volatile XAUUSD
Rule 1: Price Must Break a Previous High or Low
Don’t enter mid-range. Wait for a structural break — price must clearly close above a previous swing high (for longs) or below a previous swing low (for shorts) on the 15-min or 1H chart. This confirms directional intent and filters out sideways noise.
Rule 2: Wait for the Retest
After the break, price almost always returns to retest the broken level. This is called the “break and retest” pattern, and it’s your entry zone. This level has now flipped — old resistance becomes new support (or vice versa). Don’t enter on the break itself. Wait.
Rule 3: Enter on a Rejection Candle
At the retest zone, wait for a rejection candle — a pin bar, bullish/bearish engulfing candle, or a hammer/shooting star. This is your confirmation that smart money is defending that level. Enter at the close of the rejection candle.
Chart Example: (Place annotated XAUUSD 15-min screenshot here showing: (1) structural break highlighted, (2) retest zone marked, (3) rejection candle with entry arrow. Alt text: “XAUUSD 15-min volatility entry strategy showing break, retest and rejection candle pattern”)
Smart Money Concepts (SMC) and the Break-Retest Setup
The 3-rule entry system in this guide is rooted in Smart Money Concepts (SMC) — a framework that tracks institutional order flow rather than retail indicators. When gold breaks a previous high, it is sweeping buy-side liquidity accumulated above that level. The subsequent retest is price returning to what SMC traders call an order block — the last bullish candle before the breakout move. These order blocks act as institutional demand zones where smart money re-enters positions at better prices. Liquidity sweeps are the most common reason retail traders get stopped out on the initial break — entering too early, before institutions have finished their accumulation.
Volume Confirmation: Always verify that volume is rising during the break and declining during the retest. Rising volume on retest = red flag; setup may fail.
Mean Reversion Strategy for Gold During Volatility: When Breakouts Fail
Not every volatile gold session produces a clean breakout. When XAUUSD ATR is elevated but price keeps rejecting at a key level, the mean reversion strategy becomes relevant. This approach profits from overextended price moves that snap back to the mean.
Setup Rules:
- RSI above 78 (overbought on 1H) or below 22 (oversold) during high ATR
- Bollinger Band extreme — price touching or exceeding the outer band
- No major news in the next 2 hours
- Entry: Fade the extreme, target the 20-period moving average
- Stop: Beyond the previous candle high/low
Important: Mean reversion trades during high volatility carry higher failure rates. Use 0.5% account risk maximum on these setups, not the standard 1–2%.
Stop-Loss & Risk Management for XAUUSD — The ATR Method
Why Your Normal 20-Pip Stop Will Get Destroyed
During high volatility XAUUSD trading, a 20-pip stop loss isn’t a risk management tool — it’s a guaranteed stop-out waiting to happen. A good rule of thumb is to place your stop-loss 1.5 to 2 times the current ATR value from your entry point, which accounts for gold’s natural volatility while giving your trade enough room to play out.
The ATR-Based Stop Loss Formula for Gold
Stop Loss = Entry Price ± (ATR × 1.5)
If XAUUSD ATR = 180 pips → Your stop should be 270 pips (180 × 1.5) from entry
If XAUUSD ATR = 200 pips (FOMC week) → Stop = 300 pips from entry
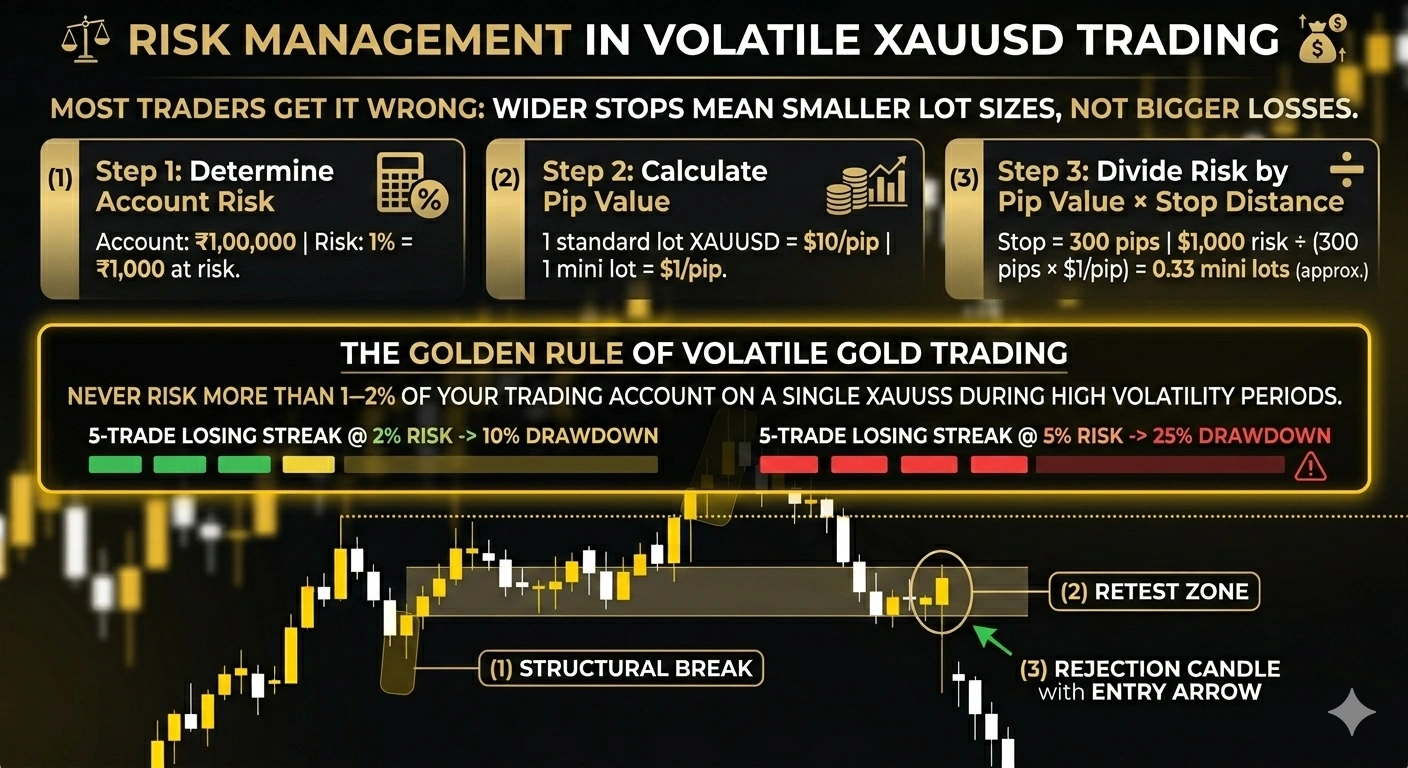
Position Sizing: The Formula Indian Traders Need
This is where most traders get it wrong. Wider stops don’t mean bigger losses — they mean smaller lot sizes. Here’s the exact calculation:
Step 1: Determine your account risk (always 1–2% in high volatility)
- Account: ₹1,00,000 | Risk: 1% = ₹1,000 at risk
Step 2: Calculate pip value for your lot size
- 1 standard lot XAUUSD = $10/pip | 1 mini lot = $1/pip
Step 3: Divide risk amount by pip value × stop distance
- Stop = 300 pips | $1,000 risk ÷ (300 pips × $1/pip) = 0.33 mini lots (approx.)
The Golden Rule of Volatile Gold Trading
Never risk more than 1–2% of your trading account on a single XAUUSD trade during high volatility periods. A losing streak of 5 trades at 2% risk = 10% drawdown. Manageable. A losing streak of 5 trades at 5% risk = 25% drawdown. Account-threatening.
MCX Gold vs XAUUSD Spot Gold: Full Comparison for Indian Traders
| Factor | MCX Gold Futures | XAUUSD Spot Gold (International) |
|---|---|---|
| Currency | Indian Rupee (INR) | US Dollar (USD) |
| Regulation | SEBI / MCX-SX | Broker-dependent (FCA, ASIC, CySEC) |
| Trading Hours | 9:00 AM – 11:30 PM IST | 24 hours, Mon–Fri |
| Contract Size | 1 kg (1000g) | 100 troy ounces (standard lot) |
| Expiry | Monthly contracts | No expiry (spot) |
| Leverage | Up to 1:15 (SEBI regulated) | Up to 1:500 (broker dependent) |
| Spread | Wider during volatility | 3–50 pips depending on broker/news |
| Best For | Hedgers, long-term investors | Active intraday and swing traders |
| Tax Treatment | Commodity tax rules apply | Treated as forex income (consult CA) |
Bottom Line: Use MCX gold for longer-term Indian rupee-hedged exposure. Use XAUUSD through an international broker for active intraday trading with the strategy in this guide.
Exit Strategy & Profit Taking During Volatile Gold Markets
Knowing when to exit is just as important as knowing when to enter. The profit-taking strategy for XAUUSD during volatility requires a scaled approach — you don’t hold 100% of a position hoping for a 300-pip run when price can reverse 200 pips in minutes.
Scaling Out: The R:R Framework
| Target Level | Action | Position % Closed |
|---|---|---|
| 1:1 R:R | Move stop to breakeven | Close 30% of position |
| 1:1.5 R:R | Hold remaining position | Close another 30% |
| 1:2 R:R | Trail stop by 1 ATR | Close another 20% |
| 1:3 R:R | Close final portion | Close remaining 20% |
Why scale out? Because in high volatility gold markets, price rarely travels in a straight line. Locking in partials lets you secure real profit while leaving room for the full move if it materialises.
Early Exit Signals — When to Close Before Your Target
Exit early if you see these gold price reversal signs:
- A major news event is 30–60 minutes away (FOMC, NFP, CPI)
- Volume suddenly spikes against your position direction
- A strong rejection candle forms at the opposite side of your target level
- The DXY reverses sharply in the direction that would pressure your gold trade
Pro Tip: Never hold a gold position through an FOMC announcement unless your stop is already at breakeven. The risk is simply not worth the reward.
Common Mistakes That Destroy Gold Traders During Volatility
Mistake 1: Trading During News Releases
The first 15–30 minutes after a major release are not a trading opportunity — they’re a trap. Bid-ask spreads on XAUUSD widen from 3–5 pips to 30–50 pips during news. Your “entry” is often far worse than your target price, and stops are triggered on spikes that immediately reverse.
Mistake 2: Using Too Much Leverage During Volatility
Leverage in XAUUSD trading amplifies every move — in both directions. During high volatility, using 1:100 or higher leverage with wide stops is a recipe for a margin call. Scale your leverage down as volatility goes up. Use 1:10 to 1:20 during FOMC weeks.
Mistake 3: Revenge Trading After a Stop-Out
You get stopped out. Gold immediately moves in your direction. You re-enter, bigger, emotionally. This is revenge trading, and it’s responsible for a disproportionate number of blown accounts. Your strategy failed this time. Your edge is statistical — it plays out over 100+ trades, not the next 5 minutes.
Mistake 4: Ignoring the Dollar Index (DXY Correlation)
Before entering any gold trade, check the US Dollar Index (DXY). The inverse correlation between gold and the DXY is one of the strongest and most consistent macro relationships in financial markets. If the DXY is in a strong uptrend, fighting it with gold longs is a low-probability trade — even if your technical setup looks perfect.
How to Use the DXY as a Real-Time Gold Filter (Step-by-Step)
The US Dollar Index (DXY) measures the dollar’s strength against a basket of 6 major currencies. Because gold is priced in USD globally, a stronger dollar makes gold more expensive for foreign buyers — suppressing demand and price. The gold-DXY inverse correlation runs at approximately -0.85 on a rolling 90-day basis, making it one of the strongest macro filters available.
Practical DXY Filter Checklist Before Every Gold Trade:
- Open the DXY on a separate chart (same timeframe as your gold entry)
- Is DXY at a key resistance level? → Gold long setups have lower probability
- Is DXY breaking below support? → Confirms gold long bias
- Is DXY in a strong uptrend above the 20-day MA? → Avoid gold longs entirely
- Is DXY forming a bearish rejection candle at resistance? → High-probability gold long setup
Mistake 5: Chasing Breakouts Without Confirmation
XAUUSD breakouts during volatility are frequently false. Price breaks a level, pulls back 150 pips, and you’re stopped out — then it continues in your original direction. The 3-rule entry system in Section 4 exists specifically to solve this problem.
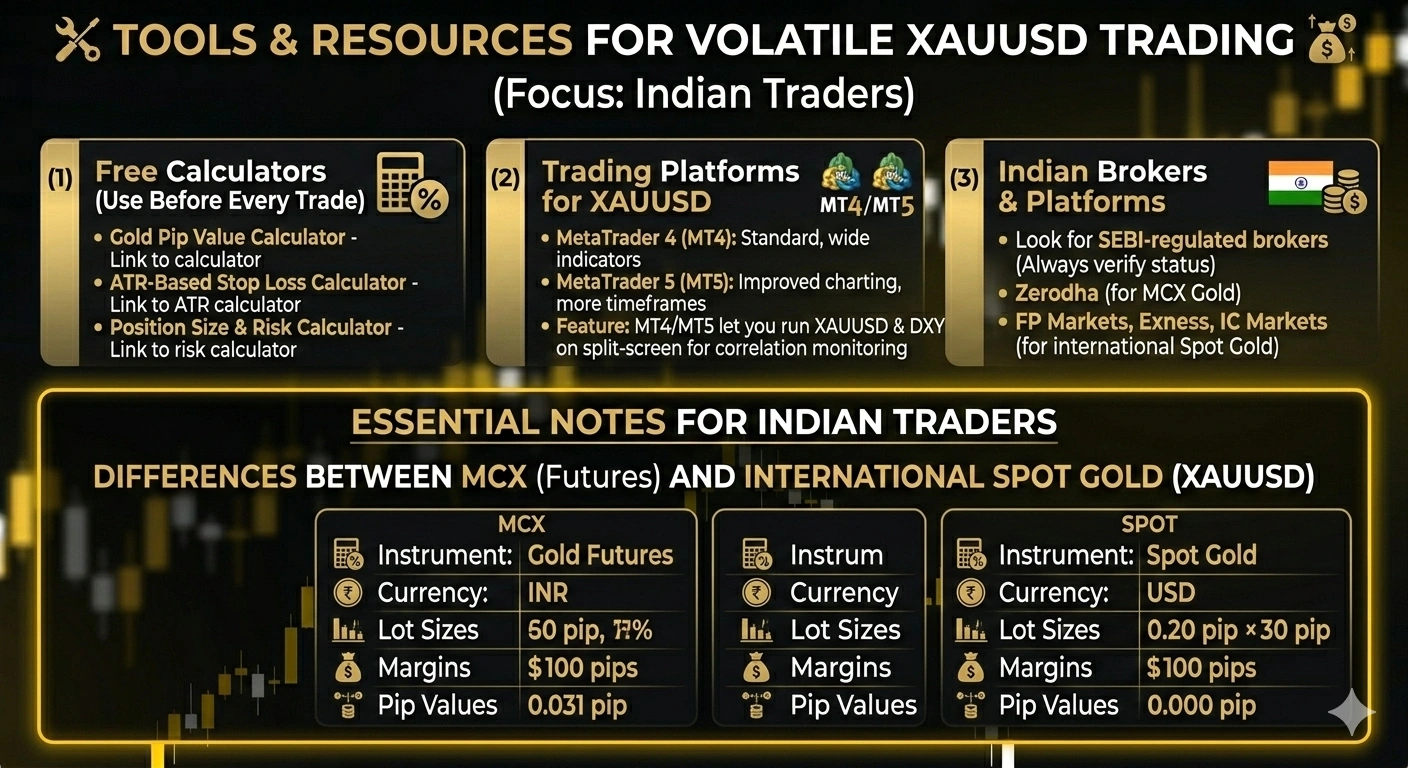
Tools & Resources for Volatile Gold Trading
To execute the strategy in this guide correctly, you need the right tools. Here are the essential resources for XAUUSD traders in India:
Free Calculators (Use These Before Every Trade)
- Gold Pip Value Calculator — Know exactly what each pip movement is worth in your account currency before you enter (Link to your gold pip calculator)
- ATR-Based Stop Loss Calculator — Input your ATR value and get your exact stop loss distance (Link to your ATR calculator)
- Position Size & Risk Calculator — Calculate the correct lot size for your account so you never risk more than 2% (Link to your risk calculator)
Trading Platforms for XAUUSD
- MetaTrader 4 (MT4) — Industry standard, wide indicator library, excellent for the strategy in this guide
- MetaTrader 5 (MT5) — Improved charting, more timeframes, better for multi-asset correlation analysis
- Both platforms let you run XAUUSD alongside the DXY on split-screen for real-time correlation monitoring
Indian Brokers That Offer XAUUSD Trading
- Look for SEBI-regulated brokers offering international CFD or forex accounts (note: always verify regulatory status before depositing)
- Popular platforms used by Indian traders for XAUUSD trading: Zerodha (for MCX gold), FP Markets, Exness, IC Markets (for international spot gold)
Note for Indian Traders: If you’re trading through MCX, you’re trading gold futures in INR. If you’re trading through an international broker, you’re trading spot gold (XAUUSD) in USD. These are different instruments with different lot sizes, margins, and pip values. See the FAQ below for a full breakdown.
FAQ — How to Trade Gold During High Volatility
Q1: What is the best indicator for gold volatility?
The Average True Range (ATR) set to 14 periods on the daily or H4 chart is the best single indicator for measuring XAUUSD volatility. It tells you how many pips gold has moved on average, which directly determines your stop loss size and position size. For confirming volatility expansion, pair ATR with Bollinger Bands — when the bands widen sharply, a significant move is already underway or imminent.
Q2: Should I trade gold on MCX or international brokers?
It depends on your goal. MCX gold trading is ideal for Indian investors who want INR-denominated exposure with SEBI regulation and delivery options. International spot gold (XAUUSD) through a forex/CFD broker is better for active day traders and swing traders who want 24-hour access, tighter spreads, and USD-based leverage. Most active traders in India use international brokers for XAUUSD intraday trading and MCX for longer-term exposure.
Q3: What leverage should I use for XAUUSD during high volatility?
During high volatility periods (ATR > 150 pips), keep leverage at 1:10 to 1:20 maximum. Many brokers offer up to 1:500 on gold — using it during volatile sessions is one of the fastest ways to trigger a margin call. Lower leverage + proper position sizing protects your account while still allowing meaningful profits.
Q4: Can beginners trade gold during high volatility?
Beginners should avoid trading XAUUSD during extreme volatility events like FOMC announcements or NFP releases until they have at least 3–6 months of consistent demo account experience. Start with the London–New York overlap session (6:30 PM–10:30 PM IST) during non-news periods to learn how gold moves. Apply the 3-rule entry system from this guide, use a demo account, and only transition to live trading once your demo results are consistently positive over 30+ trades.
Q5: What’s the difference between gold futures and spot gold (XAUUSD)?
Spot gold (XAUUSD) is the live market price of gold for immediate settlement — this is what forex and CFD traders trade 24/5. Gold futures (like those on MCX or COMEX) are contracts to buy or sell gold at a set price on a future date. Key differences: futures have expiry dates and rollover costs; spot gold does not. Futures are typically used for hedging by commercial entities; spot gold CFDs are more suited to retail intraday and swing traders due to lower margin requirements and continuous trading hours.
Pre-Trade Checklist: How to Trade Gold During High Volatility
Use this checklist before every XAUUSD trade during high volatility:
Step 1: Check the daily ATR value — is it above 150 pips? If below 80, do not trade.
Step 2: Confirm the session — are you in the London-NY overlap (6:30–10:30 PM IST)?
Step 3: Check the economic calendar — is there a major news event in the next 60 minutes?
Step 4: Open the DXY chart — is it trending against your gold trade direction?
Step 5: Identify the key structure level (swing high or low) on the 1H chart
Step 6: Wait for a confirmed structural break with a closing candle
Step 7: Let price retest the broken level — do not enter on the break candle
Step 8: Wait for a rejection candle (pin bar, engulfing, hammer) on the 15-min chart
Step 9: Calculate your ATR-based stop loss (ATR × 1.5)
Step 10: Calculate lot size — ensure risk is max 1–2% of account
Step 11: Set partial take-profit at 1:1 R:R, move stop to breakeven
Step 12: Monitor DXY and volume for early exit signals
Conclusion: Trade Gold Like a Professional, Not a Gambler
Learning how to trade gold during high volatility is not about predicting where price will go — it’s about building a process that keeps you safe when it doesn’t. The XAUUSD market rewards traders who are structured, patient, and disciplined, and it punishes those who chase, revenge trade, or ignore risk management.
To recap the complete system:
- Measure volatility with ATR before every session
- Trade only during the London–NY overlap (6:30 PM–10:30 PM IST)
- Enter using the 3-rule system: break → retest → rejection candle
- Set your ATR-based stop at 1.5–2× the current ATR value
- Never risk more than 1–2% per trade
- Scale out at 1:1.5 → 1:2 → 1:3 R:R levels
- Always check the DXY before entering any gold trade
Author: Kumkum Chandak
Kumkum Chandak Trading Research Writer & Market Content Strategist
Kumkum Chandak has 3+ years of experience writing about cryptocurrency trading, forex tools, and technical analysis for retail traders. She specializes in breaking down complex trading concepts — including pip calculators, position sizing, and risk management strategies — into clear, actionable guides for traders at every level.
Her work focuses on practical, data-backed content that helps traders make informed decisions across platforms like MT4, MT5, and major crypto exchanges.
Risk Disclaimer:
All content by Kumkum is independently researched and written strictly for educational purposes.
Last Updated: 28 February 2026