Key Takeaways
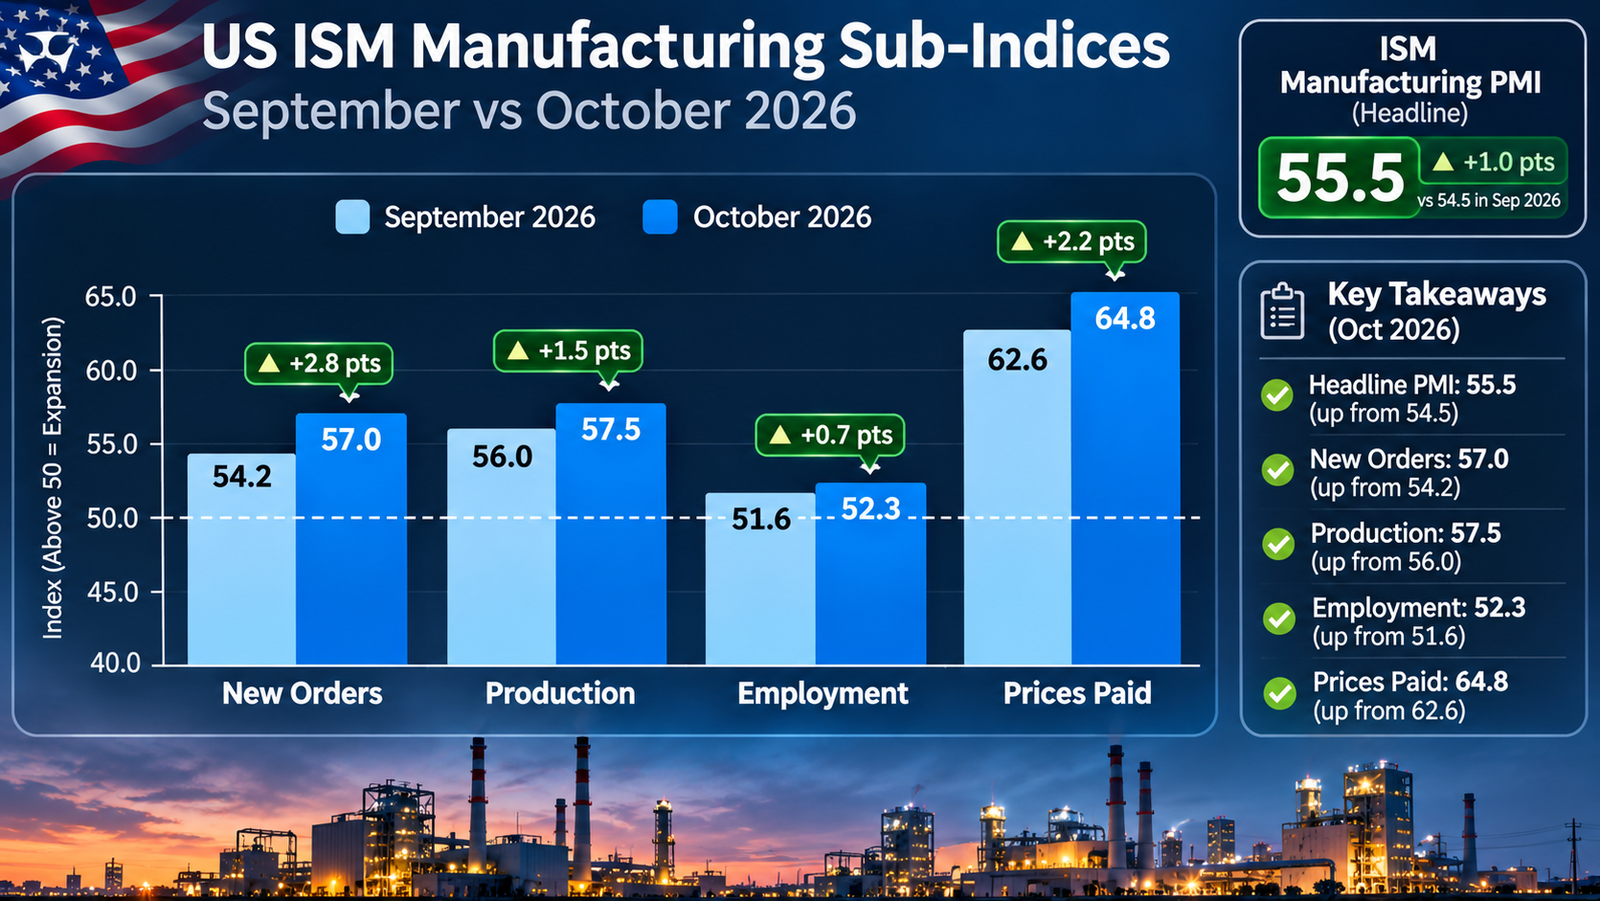
- The US ISM Manufacturing PMI rose to 55.5 in October 2026 from 54.5, beating a consensus of 54.6.
- The ISM Prices index eased to 75.2 from 77.9 but is still very high, which keeps Fed hike talk alive.
- The dollar index still hit a four-week low near 101.44 as oil and Treasury yields fell.
- India’s HSBC Manufacturing PMI eased to 54.7 from 55.1, with export orders growing at a six-month high.
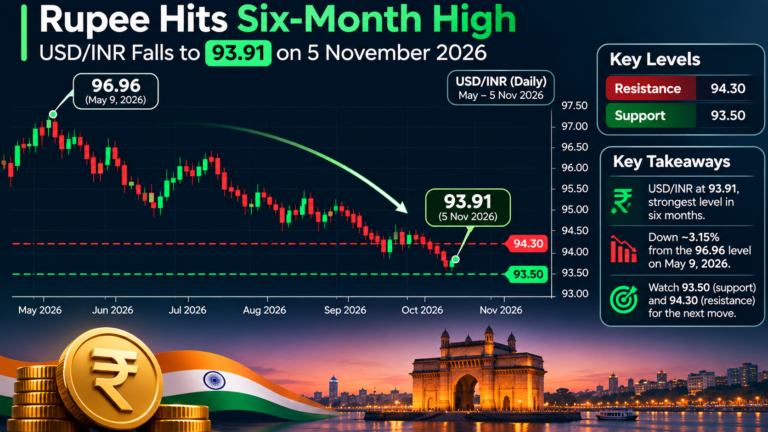
- The rupee closed at 94.84 per dollar on 2 November, 8 paise weaker, despite RBI support measures.
Monday brought two factory surveys that pointed in different directions. The ISM manufacturing PMI October 2026 dollar impact was not the simple “strong data, strong dollar” story many traders expect. US factories expanded faster, yet the dollar index fell to a four-week low because oil and bond yields dominated the session.
India’s manufacturing PMI cooled a little but stayed well above the growth line, with exporters having their best month in half a year. For traders in NSE USD/INR futures, the two readings say something useful about the Fed, the RBI and the rupee. Here is what the numbers show and what to watch next in IST.
What was the ISM manufacturing PMI October 2026 dollar impact?
The ISM Manufacturing PMI rose to 55.5 in October 2026 from 54.5 in September, above the 54.6 consensus reported by Trading Economics. Prices paid eased to 75.2 from 77.9. Even so, the dollar index fell to about 101.44, a four-week low, as falling oil prices and lower Treasury yields outweighed the strong survey.
A purchasing managers’ index (PMI) is a monthly survey of company buyers that scores business conditions, where any reading above 50 signals expansion and below 50 signals contraction. At 55.5, US manufacturing is expanding at a solid pace. ISM said this was the 10th straight month of manufacturing expansion.
The report was released at 10:00 am ET on 2 November. With US clocks back on standard time from 1 November, that was 3:00 pm GMT, or 8:30 pm IST, after NSE currency derivatives close at 5:00 pm. Indian traders felt the reaction at Tuesday’s open.
The sub-indices behind the headline
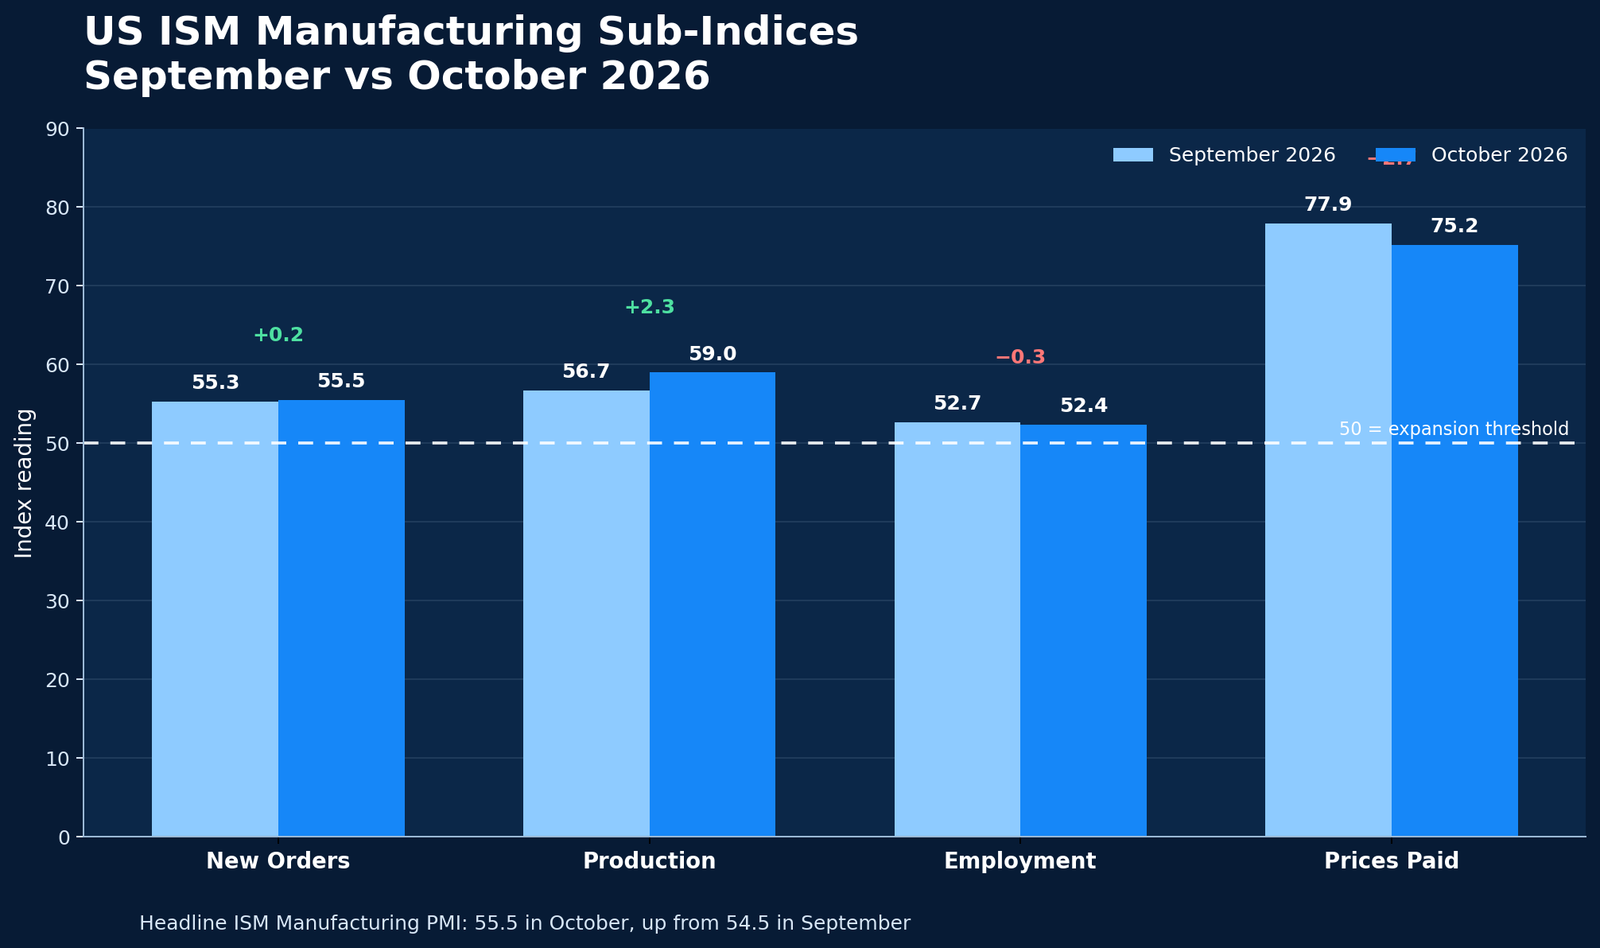
ISM data for October against September:
- New Orders: 55.5 (from 55.3)
- Production: 59.0 (from 56.7)
- Employment: 52.4 (from 52.7)
- Supplier Deliveries: 59.1 (from 59.0)
- Inventories: 51.4 (from 48.6), back to growth after contraction
- Prices: 75.2 (from 77.9), rising for the 25th month in a row
- New Export Orders: 51.2 (from 50.9)
ISM chair Susan Spence said the PMI level is consistent with about 2.7% annualised real GDP growth. Yet 66% of respondent comments were negative, often citing price volatility, tariffs and the Iran war.
Why does US ISM prices paid matter for the Fed and the dollar index?
The ISM Prices index tracks how many manufacturers report paying more for inputs. A reading of 75.2 means price increases are still widespread, even if they slowed from September. ISM linked it to steel, aluminium, tariffs and petroleum-based products.
Input costs often feed into goods inflation a few months later. When prices paid stays this high, it is harder for the Federal Reserve to sound relaxed, which usually supports Treasury yields and the dollar.
The Fed rate outlook for December 2026
After the Fed’s October rate decision, where rates were held, Trading Economics reported that markets were pricing roughly a 75% chance of a 25 basis point hike in December. On 3 November that estimate was about 73%. The next policy meeting is listed on the Federal Reserve FOMC meeting calendar for 8–9 December 2026, with fresh economic projections.
A strong ISM with sticky prices fits the hike case; a softer prices index fits patience. October’s report gave both camps something.
Why the dollar index after ISM still fell
The dollar index (DXY) measures the US dollar against a basket of six major currencies, led by the euro. On 2 November it dropped to 101.44, its lowest since September, per Trading Economics. The cited drivers were falling oil on hopes of US-Iran diplomacy, and expected rate hikes by other central banks.
The US 10-year Treasury yield fell to about 4.89%, its lowest since mid-September, on the same oil-driven inflation relief. The ISM beat did not reverse the trend, which traders often see when one theme, here oil and geopolitics, is steering the market. For the bigger picture, see our dollar index outlook for November 2026.
How did India’s manufacturing PMI for October 2026 compare?
The HSBC India Manufacturing PMI, compiled by S&P Global, eased to 54.7 in October from 55.1 in September. The flash estimate had been 54.9, so the final number was revised down. It is still comfortably above 50, which means Indian factory activity kept growing, just slightly more slowly.
The standout was exports. New export orders grew at their fastest pace in six months. Overall new orders kept rising strongly, though growth slowed from September’s seven-month high. Employment rose for a second month, but only modestly. Input cost inflation eased to its lowest since February, and selling-price inflation was the weakest in nearly four years.
| Indicator (October 2026) | US ISM Manufacturing | India HSBC Manufacturing |
|---|---|---|
| Headline PMI | 55.5 | 54.7 |
| Previous month (September) | 54.5 | 55.1 |
| Consensus / flash | 54.6 consensus | 54.9 flash |
| New orders | 55.5, faster growth | Strong growth, slower than September |
| Export orders | 51.2 | Fastest growth in six months |
| Employment | 52.4, slower growth | Second month of modest gains |
| Prices | Prices index 75.2 (from 77.9) | Input inflation lowest since February |
| Release time (IST) | 8:30 pm, 2 Nov | Morning of 2 Nov |
India’s sub-index values were not published in the reports checked, so the table shows direction only. Compared with the flash PMI readings for October, the final India number confirms a slight downgrade.
What does this mean for USD/INR, the rupee and the RBI?
The rupee closed at 94.84 per dollar on 2 November, 8 paise weaker on the day, as PTI reported a firm dollar weighing on it. Trading Economics pointed to RBI measures that limited the damage: a special dollar window for state-run oil refiners that cut their spot dollar buying, and FCNR(B) deposit inflows. Easing crude prices also helped.
The India PMI matters to the rupee more quietly. Cooling price inflation helps the Reserve Bank of India, and stronger export orders can, over time, support dollar inflows.
Reading the USD/INR PMI reaction correctly
USD/INR rarely jumps on a PMI alone. RBI intervention, crude oil, foreign portfolio flows and the broad dollar matter more. This week the bigger risks are an oil reversal or a US jobs surprise; Trading Economics also flagged firm Treasury yields and foreign outflows.
For Indian residents, the legal route to trade these moves is exchange-traded currency derivatives in permitted pairs on NSE, BSE or MSE through a SEBI-registered broker. Our guide to trading USD/INR covers contracts, timings and margins.
How much does a 10-paise move cost on NSE USD/INR futures?
On NSE, one USD/INR futures lot is US$1,000 and the tick size is ₹0.0025 (0.25 paise). That makes each 1 paisa move worth ₹10 per lot (₹0.01 × 1,000). A 10-paise move is ₹100 per lot.
Example (hypothetical): a trader with ₹1,00,000 in a trading account buys 2 lots of near-month USD/INR futures at 94.85 on Tuesday morning, expecting the dollar to firm after the ISM beat.
- If USD/INR rises 10 paise to 94.95: profit = 10 paise × ₹10 × 2 lots = ₹200, or 0.2% of capital.
- If USD/INR falls 10 paise to 94.75: loss = ₹200.
- If the trader risks 1% of capital (₹1,000), the stop can sit 50 paise away for 2 lots (50 × ₹10 × 2 = ₹1,000).
Prices are hypothetical and ignore brokerage, charges and taxes.
How to size a trade around PMI week
- Decide the maximum rupee loss per trade, for example 1% of capital.
- Mark a stop level based on recent ranges, not the headline number.
- Convert the stop distance into paise and multiply by ₹10 per lot.
- Divide your rupee risk by the per-lot risk to get the lot count.
- Recheck the numbers before placing the order.
What to watch next: US services ISM, NFP and India services PMI
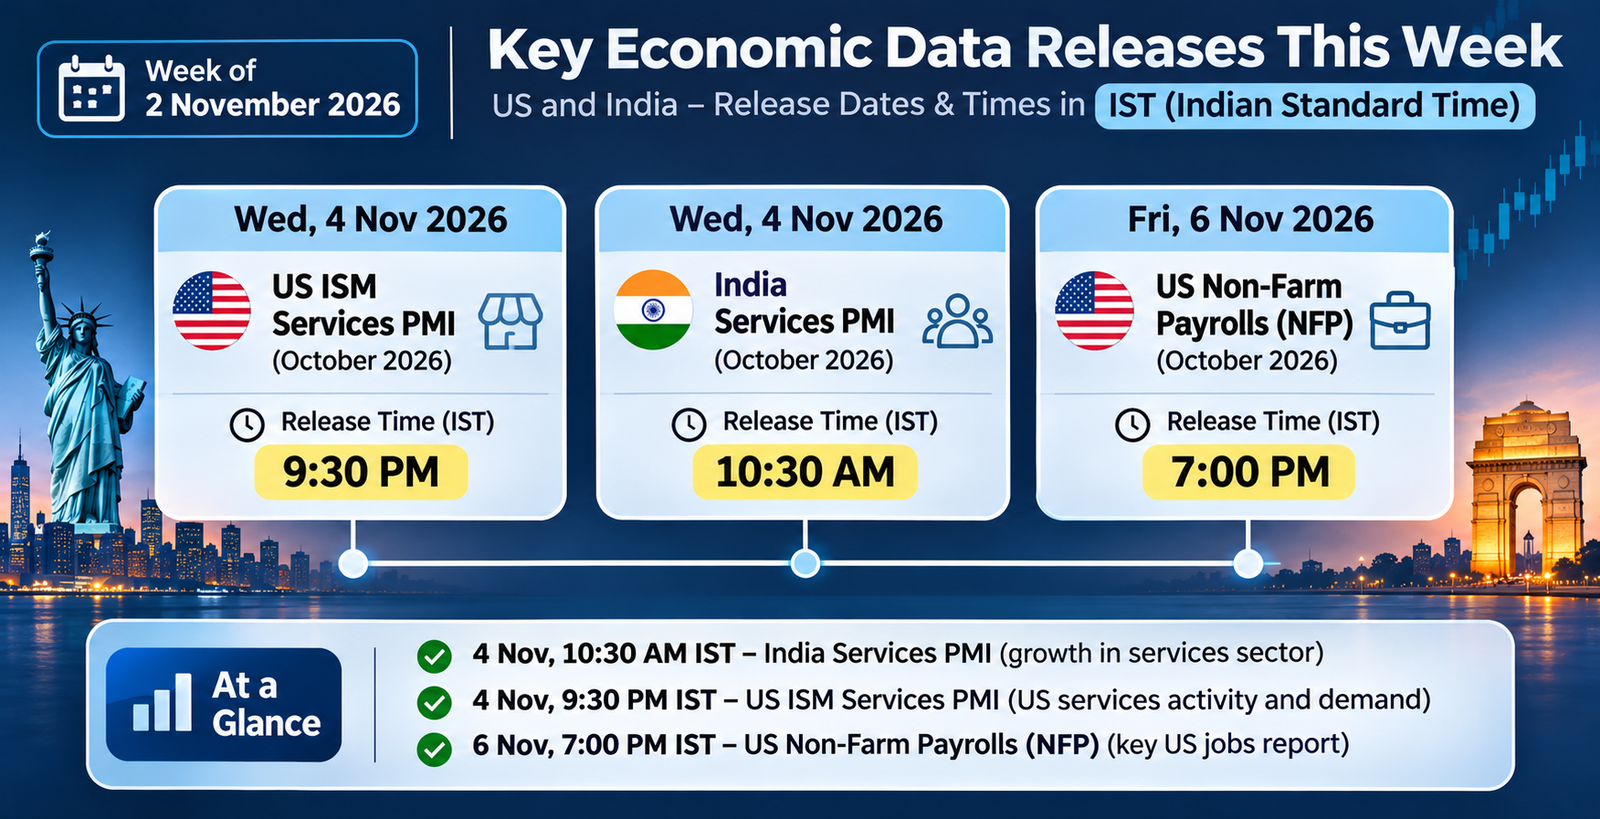
The factory surveys are only the first piece of a busy week. Key dates, converted to IST:
- HSBC India Services PMI (October): 4 November, 05:00 UTC, which is 10:30 am IST, per the S&P Global release calendar.
- US ISM Services PMI (October): 4 November, 10:00 am ET, which is 8:30 pm IST. A strong services prices reading would support the December hike case.
- US Employment Situation (October non-farm payrolls): 6 November, 8:30 am ET, which is 7:00 pm IST, per the BLS schedule. Usually the month’s biggest dollar mover.
- Next ISM Manufacturing report (November data): 1 December, 10:00 am ET (8:30 pm IST).
- Next HSBC India Manufacturing PMI: 1 December, 10:30 am IST.
Add these to the InsightfulTrade economic calendar so you are not caught by a late-evening release.
Common mistakes traders make with PMI data
- Reading the headline only. October’s headline rose while prices paid fell.
- Assuming a strong US number always lifts USD/INR. On 2 November, oil and yields pushed the dollar index lower even as the ISM beat.
- Forgetting the time zone. ISM lands at 8:30 pm IST, after NSE closes, so gap risk sits at the next open.
- Oversizing before NFP on 6 November without a defined stop.
FAQs
What is a manufacturing PMI and what does 50 mean?
A manufacturing PMI is a monthly survey of purchasing managers that scores factory conditions such as new orders, output, jobs and prices. A reading above 50 means activity expanded compared with the previous month, and below 50 means it contracted. October’s US reading of 55.5 and India’s 54.7 both signal clear expansion.
What time is the ISM manufacturing PMI released in IST?
ISM publishes at 10:00 am Eastern Time on the first business day of the month. With the US on standard time from 1 November 2026, that equals 8:30 pm IST. During US daylight saving time, it arrives an hour earlier at 7:30 pm IST, so check the calendar each month.
Why did the dollar fall after a strong ISM report?
The dollar index fell to about 101.44 on 2 November because falling oil prices and lower Treasury yields outweighed the survey. Hopes of a diplomatic path in the US-Iran conflict eased inflation worries. A slower rise in ISM prices paid also gave bond markets some relief, limiting any boost from the stronger headline.
Does the ISM prices index change the Fed rate outlook for December 2026?
It feeds into it. Prices at 75.2 are still very high, which supports the view that inflation pressure persists. Trading Economics reported markets pricing roughly a 73–75% chance of a December hike. The October jobs report and inflation data before the 8–9 December FOMC meeting will matter more than one survey.
How did USD/INR react to the PMI data?
The rupee closed at 94.84 per dollar on 2 November, 8 paise weaker, as a firm dollar weighed on it. RBI measures, including a dollar window for oil refiners and FCNR(B) inflows, plus softer crude, limited the move. India’s PMI, released in the morning, was not the main driver, and the US ISM came after the NSE close.
Is India’s manufacturing PMI slowdown a worry for the rupee?
Not on its own. The PMI eased only slightly to 54.7 and stays well above 50. Export orders grew at a six-month high and price pressures cooled, both mildly helpful for the rupee and the RBI. Oil prices, foreign flows and the broad dollar matter far more for USD/INR than one PMI reading.
Conclusion
The ISM manufacturing PMI October 2026 dollar impact was a lesson in context. US factories grew faster at 55.5, prices paid stayed high at 75.2, and yet the dollar index slid because oil and yields set the tone. India’s PMI cooled slightly to 54.7 while exporters had a strong month, and RBI support kept the rupee’s dip small. This week, services PMIs on 4 November and US payrolls on 6 November will test whether the December Fed hike pricing holds. Before trading those releases, size your USD/INR position with the position size calculator and keep stops defined in paise.