Quick Summary
As a trader, it is essential to understand market turning points. In that case, the support resistance strategy is one of the oldest and simplest price action methods that can help you in technical trading.
This guide covers what it is, how it works, the best tips, and common mistakes to help traders like you, whether you’re a beginner or an experienced trader. Let’s discuss it together step-by-step.
What Is the Support Resistance Strategy, and Why Do Traders Trust It?
As you all know, the support resistance strategy is a price action method that revolves around two key levels. Let’s see what those are:
- Support: Support is the price level that acts like a floor. In support, a downtrend tends to pause or reverse when buyers enter the market.
- Resistance: While resistance acts like a ceiling, supply increases when the price reaches resistance.
Reasons why these levels form:
- Supply or demand imbalances
- Market psychology
- Institutional orders
- Stop-loss clusters
Why trust it?
- If you trade in stocks, crypto, forex, or commodities, it works in all markets.
- It is also easy and simple to understand for beginners.
- Support and resistance remain reliable and relevant in any timeframe.
- It helps you in spotting changes in trends and breakout setups.
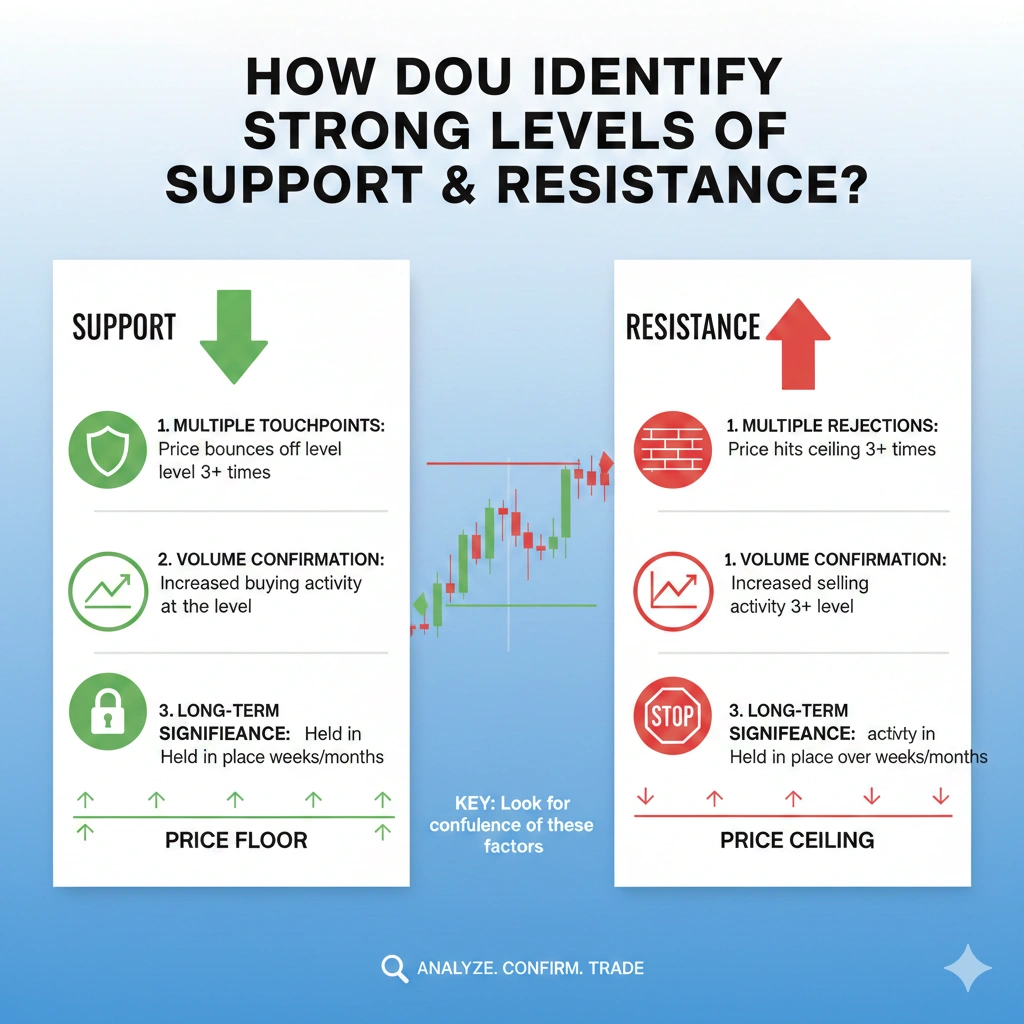
How Do You Identify Strong Levels of Support and Resistance?
Here are some key methods to identify strong levels:
- Multiple Touchpoints—It becomes strong when the price is touched two to three times or more. The more price bounces, the more reliable and stronger.
- Volume Reactions—High-volume reactions are considered stronger and show that major market participants are selling and buying there.
- Strong Reversal Candles—You’re able to identify powerful support and resistance with them.
- Timeframe Confirmation—If the timeframe is longer, it strengthens support and resistance levels for the participants who trade with larger capital.
How Much Risk Should You Take Per Trade?
You should always follow a strict rule of only 1-2% per trade. Let’s understand with a table:
Lot Size Example for EURUSD
| Amount | 1% Risk | Stop Loss | Lot Size |
| $100 | $1 | 20 pips | 0.005 |
| $500 | $5 | 20 pips | 0.025 |
| $1,000 | $10 | 20 pips | 0.05 |
What Are the Best Tips for Improving Your Support Resistance Strategy?
Are you also interested in improvising your support and resistance strategy? Let’s see together how you can elevate your SR strategy:
- First of all, use multiple timeframes that allow you to know stronger zones and improve your entry and exit decisions.
- Combine your SR strategy with trend analysis.
- For risk management, use stop-loss wisely, which ensures a single trade does not impact your capital.
- Backtest your strategy on a regular basis and review past trades to understand mistakes and adjust it.

How Can You Combine Support and Resistance With Other Indicators?
Here are some indicators that can help you in increasing accuracy by combining with support resistance strategy:
- Moving Average
If you combine moving average with SR strategy, it will strengthen the trade signal, improve accuracy, and filter false setups.
- Volume
If volume is high at support, it means strong buyer interest. But, at resistance, it indicates high selling.
- Trendlines
Combing it with SR can create strong zone, where price reacts more reliably and helps you improve timing, false entries, etc.
- Fibonacci Retracement
Aligning it with SR can create a powerful confluence
By blending these indicators with the SR strategy, you can gain better confirmation and more precise entry points.
Why Does the Support Resistance Strategy Work Better in Trending Markets?
In trending markets, it works better because price tends to move in a clear direction.
- In Uptrends: As buyers consistently step in, form higher highs and higher lows, and make price bounces more reliable.
- In Downtrends: On the other side, the market forms lower lows and lower highs, with sellers controlling the price movement.
Overall, if you combine trend identification with support and resistance levels, it will increase your profit potential, manage risk, and enhance trade timing.
How Do You Set Stop-Loss & Take-Profit Using Support and Resistance?
A fundamental technique that allows you to manage your risk and align your trade with key market levels. Here’s how to do it:
-
Identify key support and resistance levels
Don’t place any trade without identifying strong support and resistance levels on your chart.
-
Setting Stop-Loss
Limit your loss with the help of stop-loss, which ensures if the price goes against you, your losses are minimized.
-
Setting Take-Profit
Lock your profit with take-profit, which automatically books your profit when the price reaches a target level.
-
Use Risk-Reward Ratio
Many traders fix their ratios at least at 1:2 to maintain their risk. It means the potential profit should be twice the amount that you are risking.
-
Adjust Dynamically
When stop-loss or take-profit don’t work, adjusting dynamically can save you from bearing loss and also allows you to protect profits while giving trades room to grow.

What Are Common Mistakes in the Support Resistance Strategy?
Here are some common SR trading mistakes that traders make with this strategy.
- If you’re drawing too many levels, that results in creating confusion to spot which zone is strongest.
- If you ignore the higher timeframes, that leads to weak levels.
- Enters into a trade blindly without confirmation signals, such as volume spikes, pin bars, etc.
- If you don’t have proper management for risk and place stop-losses too close together.
- Not following the trend and still using the old levels and strategies.
By avoiding these SR trading mistakes, you can get better results in your trade, so keep these in mind.
Real Market Example: How the Support Resistance Strategy Works (EUR/USD)
Let’s see a quick and simple real market example to make you understand how the support resistance strategy works on EUR/USD.
As an illustration:
- Support- 1.0700 zone
- Price bounced- 4 times
- Each bounce gives- 50-120 pips
As per the above-given data, it shows that every time the price bounced, buyers entered the market, pushing it upward, and pips show the profitable opportunities for traders by using the support resistance strategy.
Is Support and Resistance Enough to Trade Profitably?
Depending only on support resistance strategy is not enough. They are considered powerful tools, but you should also combine SR levels with risk management, candlestick patterns, or trend analysis that helps you in profitable trading.
In essence, it is a highly reliable and recommendable tool, but only after combining it with proper risk management and confirmations.
FAQs on Support Resistance Strategy
- How many levels should you keep on your chart?
Ideally, 3-5 levels, because too many levels can create confusion, and you can hesitate during entries. Clean charts help you in maintaining a disciplined approach.
- Which timeframe is best for support resistance?
The best timeframe is the daily chart for major levels and H1/M15 for entries that ensure accuracy and provide you with clear confirmation.
- Do support and resistance work in forex?
Yes, it works extremely well in forex by providing a reliable structure and clearer entries as compared to many indicator-based methods.
- How to avoid fakeouts when trading support and resistance?
To avoid fakeouts, avoid high-impact news and always wait for a confirmed candle close that gives you safer and more reliable trade setups.
- Is support resistance suitable for beginners?
Yes, if you’re also a beginner, it is ideal for you because it is a simple and easy-to-understand method.
Final Thoughts
As we step into 2026, many traders, including you, are thinking, “Does this strategy still work in today’s fast-moving markets?” The answer is yes. Using this strategy with patience and risk management can help you make informed decisions rather than guessing the market conditions for your trading. These are rooted in human behavior, market psychology, etc.
In this constantly and rapidly evolving market, you can’t rely only on drawing simple horizontal lines. If you adapt it, you’ll find more trading opportunities in 2026 and beyond.
Are you also ready to apply the support resistance strategy? Transform your trading with Insightful Trade and get expert-guided analysis. Sign up and start your smarter trading journey today!
Author: Arihant Jain
Trading Experience: 5+ Years
Arihant Jain is a financial markets analyst and trading educator with expertise in Forex, indices, crypto, and risk-managed trading systems. His insights are based on real trading experience, data-driven analysis, and transparent market understanding. All content is reviewed for accuracy and aligns with Google’s EEAT guidelines.
Risk Disclaimer:
Trading involves substantial risk. All information is for educational purposes only and should not be taken as financial advice. Always do your own research.
Last Updated: 15 December 2025