Quick Summary
Internal external liquidity is a modern way to look at the markets, especially in forex, to figure out exactly how and why prices are shifting. Instead of just staring at the basic support and resistance, this concept focuses on looking at where clusters of orders are hidden. Internal liquidity is what’s tucked inside a price range, while external liquidity sits just past the major highs and lows. In this blog, we are going to look at how price reacts around these specific zones so you can start predicting market swings with more logic rather than guessing.
Introductory Comparison Table
| Liquidity Type | What It Is | Typical Location | How Price Interacts |
| Internal | Orders inside a range | Inside the swing high/low | Attracts short-term price retracements, fills imbalances |
| External | Orders outside a range | Above highs / below lows | Draws price for breakout/stop hunts |
| Buy-Side | buy orders & stops | Above bearish levels | Targeted during upward moves |
| Sell-Side | sell orders & stops | Below bullish levels | Targeted during downward moves |
So, What Exactly Is Internal External Liquidity?
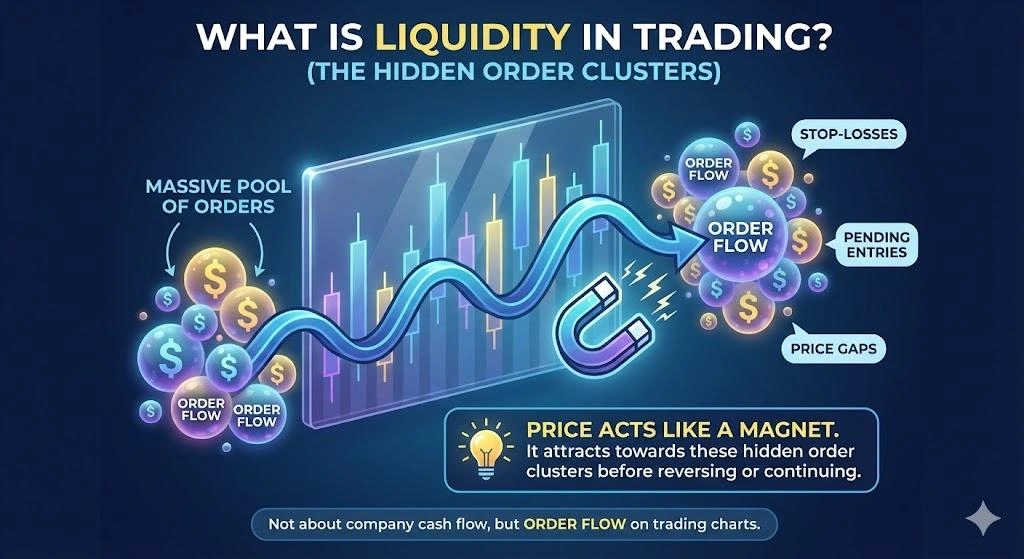
In trading, liquidity means the massive pool of orders. This includes the clusters of stop-losses, pending entries, or messy price gaps. These spots are a big deal because price acts like a magnet and attracts toward them before it either reverses or continues moving ahead.
Just to be clear, this internal external liquidity is not what you talk about in an accounting class, it’s not about a company’s cash flow. It’s about order flow and how the price moves in trading charts.
When applying this concept in forex, you’re dividing the chart into two parts:
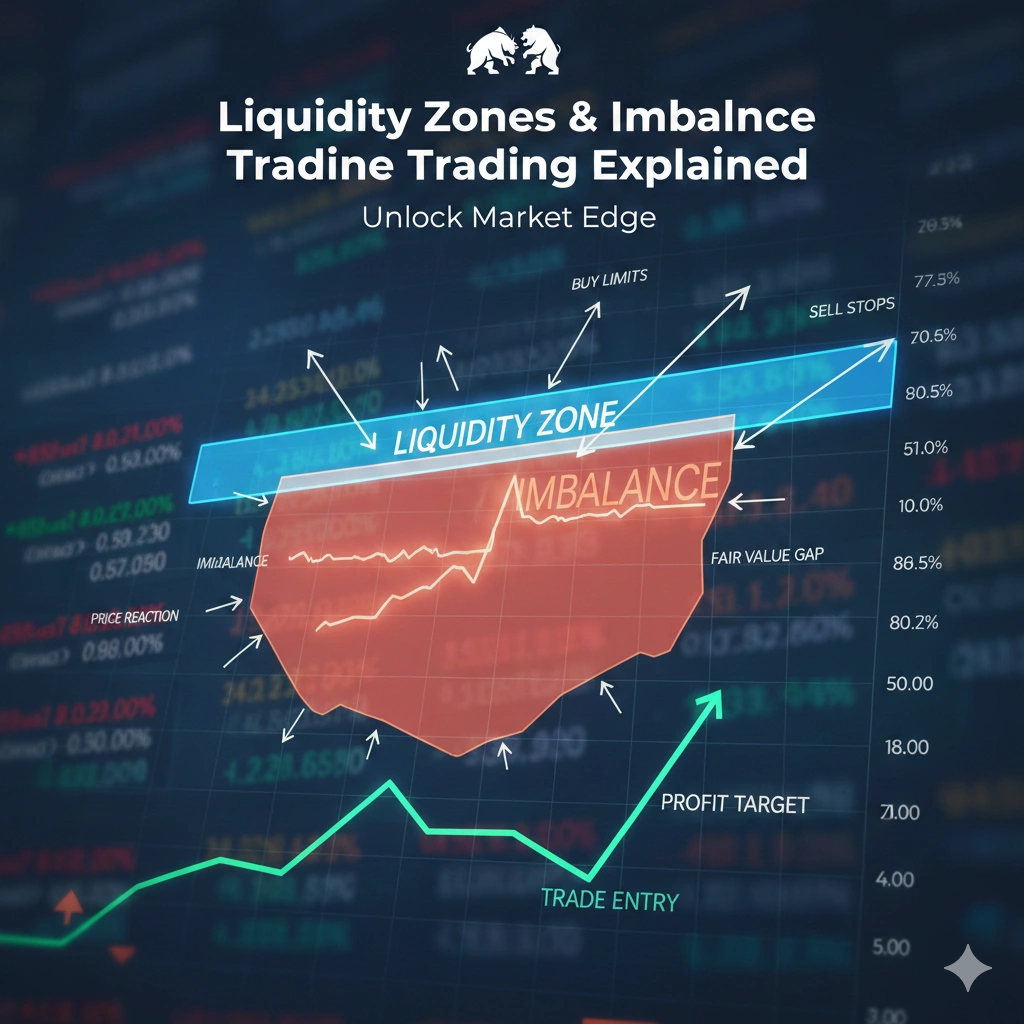
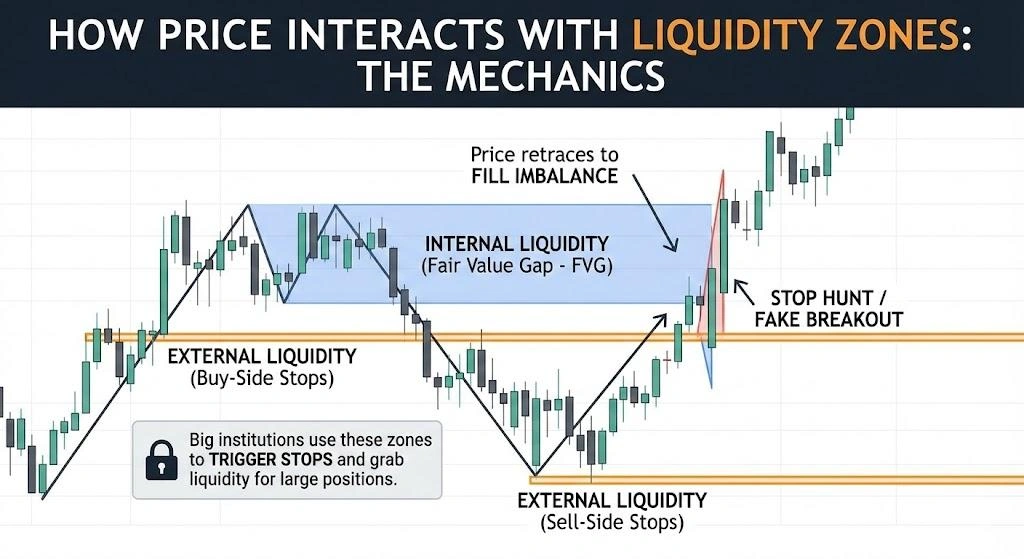
- Internal Liquidity: Liquidity within the current price range. It often forms in fair value gaps or within consolidation areas.
- External Liquidity: Liquidity that lies outside the range — typically at old swing highs or swing lows.
This approach comes from institutional order flow logic: Big institutions can’t just click buy whenever they want, they need a huge pool of orders to get their trades filled without moving the market too much. If you’re able to find these spots, you can easily stay one step ahead of the next price move.
Why Traditional Technical Levels Aren’t Enough
Most traditional technical analysis is built on indicators like moving averages or Fibonacci levels. They’re helpful, but they don’t explain the real reason on why the prices move toward these specific zones.
This is exactly what internal external liquidity do. It explains the why by focusing on hidden order clusters rather than just looking at the chart patterns.
How Internal Liquidity Works
Internal liquidity is basically the actions happening inside a specific price range. If you are looking at forex chart, this look like:
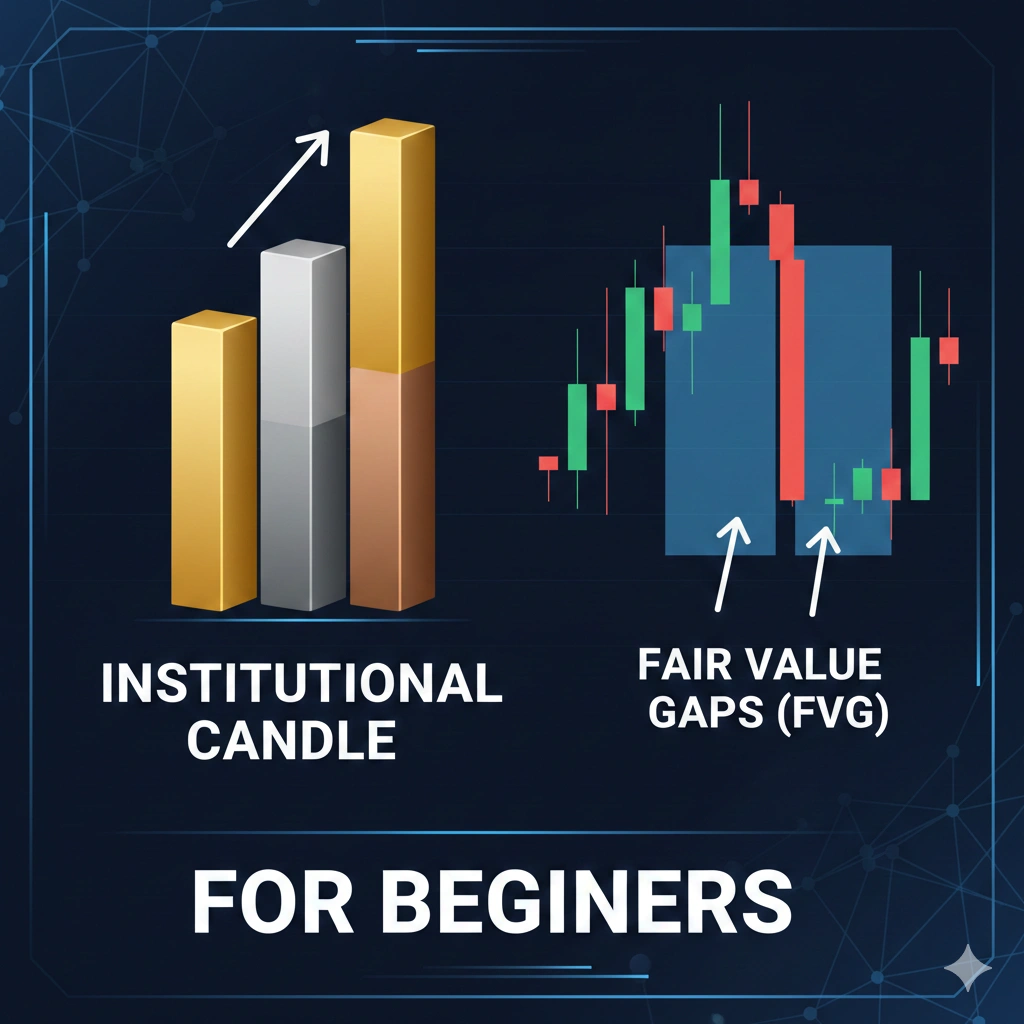
- Fair Value Gaps (FVGs): These are empty spots left behind when price moves so fast that it doesn’t give a chance to orders to catch up.
- Small swing points that show up on the 5 or 15-minute charts.
- Order blocks or consolidation zones where institutional orders may lie.
Example:
Imagine EUR/USD is bouncing between 1.0800 and 1.0850.
- Price hits the top at 1.0850, then pulls back.
- That dip leaves a messy gap around 1.0825, that’s your internal liquidity.
- Big institutions may use these gaps to fill their orders.
- Price often returns to fill this gap before heading to larger (external) liquidity.
Why this is important:
Internal liquidity is closer and more easier for the market to reach and grab. When you see prices toward these internal zones, it’s usually a big hint that a quick pullback is happening or that trend is just catching its breath before the next move.
How External Liquidity Works
External liquidity is basically everything sitting outside the boundaries of the current range. In forex, we’re talking about:
- Previous swing highs and lows.
- Major psychological levels like round numbers.
- The high or low of the day, week or month.
These spots are like magnets because that’s where most of the traders hide their stop losses. And big institutes are well aware of this, and they’ll often steer the price into these zones just to trigger those stops, grabbing the liquidity they need for bigger positions.
For Example:
- EUR/USD reaches 1.0850 and stalls.
- Instead of reversing from the level, the price might move ahead to the level where most of the buy-stops are sitting.
- This stop hunt gathers external liquidity the big players were looking for before the actual move starts.
Why this matters:
This is where the most important action happens on the chart. Understanding these zones help you spot the fake breakouts and tell you if a trend is going to reverse or keep charging once those orders are cleared out.
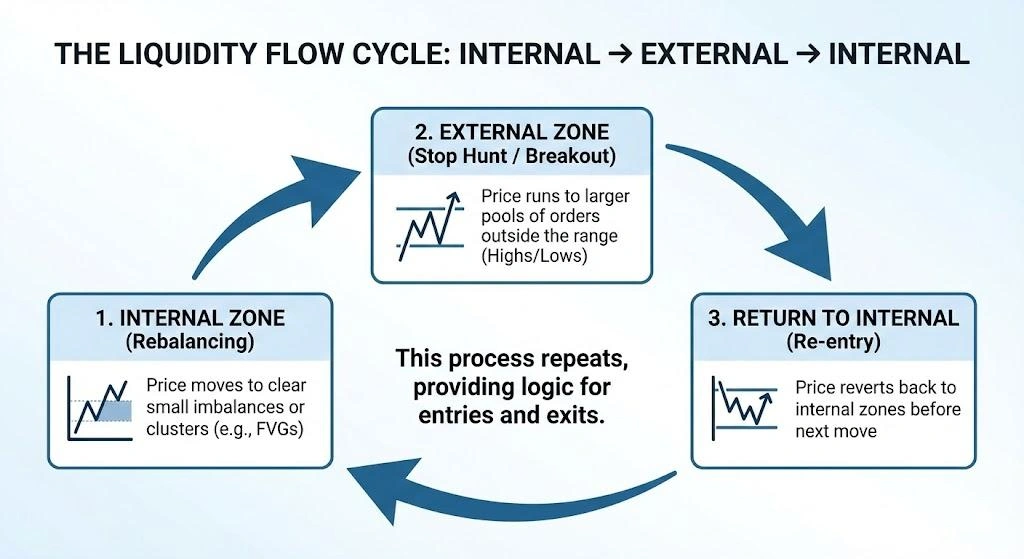
The Liquidity Flow: Internal → External → Internal
The main thing you need to keep in mind is that prices basically just moves back and forth between internal and external levels:
- First the price would move toward the internal zone to clear out small imbalances or clusters.
- Then it runs towards the external zones, the larger pools of orders outside the range.
- After hitting the external target, it will revert back to those internal zones again before its next move.
This process repeats again and again, which gives you a solid logic for both where to enter and where to get out.
For Example:
Take GBP/JPY in a range, for example:
- Internal liquidity is sitting at some fair value gaps between 179.50–180.00.
- External liquidity is at 180.30 (high) and 179.00 (low).
Scenario:
- Price first dips to 179.60 (internal), then retraces.
- It climbs to 180.30 (external liquidity), triggering buy stops.
- Once it hits those external zones, it usually drifts right back toward those internal zones again.
The Takeway
Can use this process to figure out:
- Exactly where the market is likely to move next.
- Which spot on the chart has high-probability targets for your take profits?
Why This Approach Is Useful (Not Just What It Is)
Most Forex traders watch indicators or wait for the pattern to show up, but those lagging tools are basically just telling what has already happened.
Internal and external liquidity explains why the price moved in the first place.
It gives you a logical reason based on how order works, especially where money is hiding and how it pulls the price toward it.
- Institutional logic: The big banks and institutions need large liquidity to place their own orders. For which they often lead prices to zones where these orders pile up.
- Smarter Risk management: After knowing where these liquidity zones are, you can easily set stops and targets that actually make sense.
- Market context: Instead of taking a wild guess at the next breakout, you start seeing liquidity as the actual force driving the move.
Common Mistakes Traders Make With Liquidity
- Mistaking External Levels with Support/Resistance:
Those old highs might look like solid resistance to retail traders, but in the liquidity, they are just targets for a quick stop hunt right before the real trend starts. - Ignoring Internal Liquidity:
Most of the traders are so busy looking for the breakout that they miss the internal zones, which help you spot the entry. - Over-trusting Indicators Alone:
Indicators definitely make your chart look more clear, but at the end of the day, they’re just math; they don’t show you exactly where the actual liquidity is hiding.
Conclusion
Look, internal external liquidity is one of the most practical ways to understand how prices actually behave. It clearly explains how the price moves toward where orders are clustered, rather than just because a pattern is forming. And by identifying both internal zones and external targets, you can easily predict the next price move and manage your risk effectively.
If you are a trader looking for guidance and clear, precise teaching of complex concepts of trading’ then you should visit Insightful Trade’s website. Here, they provide well-researched content, which helps in better understanding of the market and especially for risk management.
FAQs
- What tools help identify internal external liquidity in forex?
There are some classic tools that help find fair value, swing highs/lows, and range structure. The most popular ones are TradingView or MT4. - How does this concept fit into India’s regulated forex markets?
The analysis stays the same; you just need to follow the SEBI-provided guidelines, and you can apply these concepts while ensuring your trade stays strictly legal. - Is this approach suitable for beginners?
Though this approach is a bit more advanced than the regular one, beginners can still start by watching simple highs and lows before they move to the complex market structure. - Can internal external liquidity be applied to other markets (stocks/crypto)?
Of course. These concepts are universal for any active market, though the specific rules and how you execute them might change according to the Asset.
Author: Kumkum Chandak
Experience: 3+ Years in Trading Research & Market Content Strategy
Kumkum Chandak is a trading content strategist and market research writer who specializes in simplifying technical analysis, trading tools, and strategy-driven educational content. Her work is optimized for EEAT, accuracy, and user intent, ensuring every article delivers practical insights for traders of all levels.
Risk Disclaimer:
All content is strictly educational and not financial advice. Trading involves substantial risk. Always perform your own analysis or consult a professional advisor.
Last Updated: 17 January 2026