Quick Summary
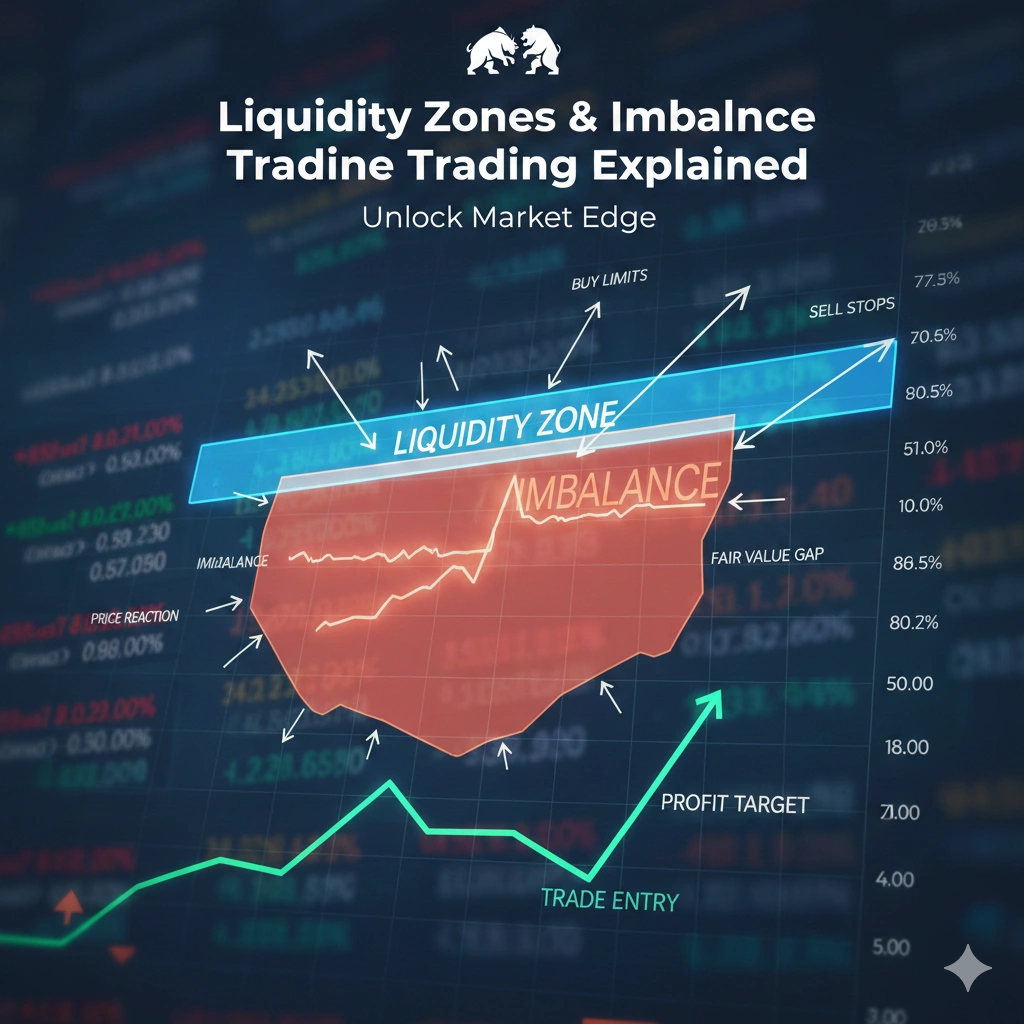
Imbalance trading is all about how price reacts when both buyers and sellers are fighting over which direction the market will take. Rather than just depending on indicators, spotting these imbalances will help you understand why prices move so suddenly, where inefficiencies occur, and why it usually reverses back to fill them later. In this blog, we’ll break down the core principle of imbalance, connect it to strategies you can actually use, and explain what price imbalance looks like in a real market context.
Core takeaways:
- Imbalance happens when there is a huge gap between the numbers of buyers and sellers.
- This often leaves behind cracks or inefficiencies in the chart that the market eventually likes to reverse and repair.
- You can use this logic to see if the price is going to reverse or keep moving ahead.
- Investors need to understand risk management and market context at the same level as these concepts to avoid making wrong investment choices.
The Core Problem: Why Price Imbalances Exist
At its core, imbalance trading logic is based on the simple fact that supply and demand runs the show. When one side, either buyers or suppliers, completely overpowers the other, the price just takes off in their direction as a market tries to find more orders. This isn’t just small classroom theory; it’s the real-world mechanism that you see actually happening right on your charts.
In the real world, you will often see these imbalances when:
- Big institutional orders often crush smaller retail ones, sending the price flying without giving it a chance to pull back.
- Big news events create uncertainty in the market, letting one side of the trade totally dominate the other.
- A low-volume market allows even a normal-size trade to cause a huge price swing.
All of these create imbalance in the area where price moved too fast because one side had way too much power. Learning how to identify these gaps and knowing that the market usually likes to revisit and fix them back later is exactly what imbalance trading logic is about.
Price Imbalance: Explanation and Market Behavior
To understand price imbalance, you first need to understand how price actually moves across the charts. A heavy imbalance in markets appears as a fast, aggressive jump in one direction without leaving any room for correction.
What Imbalances Look Like
-
- Bullish imbalance: In this buyers are in control, and price moves upward with a small pullpack.
- Bearish imbalance: The market demonstrates seller control causing prices to fall at a fast rate.
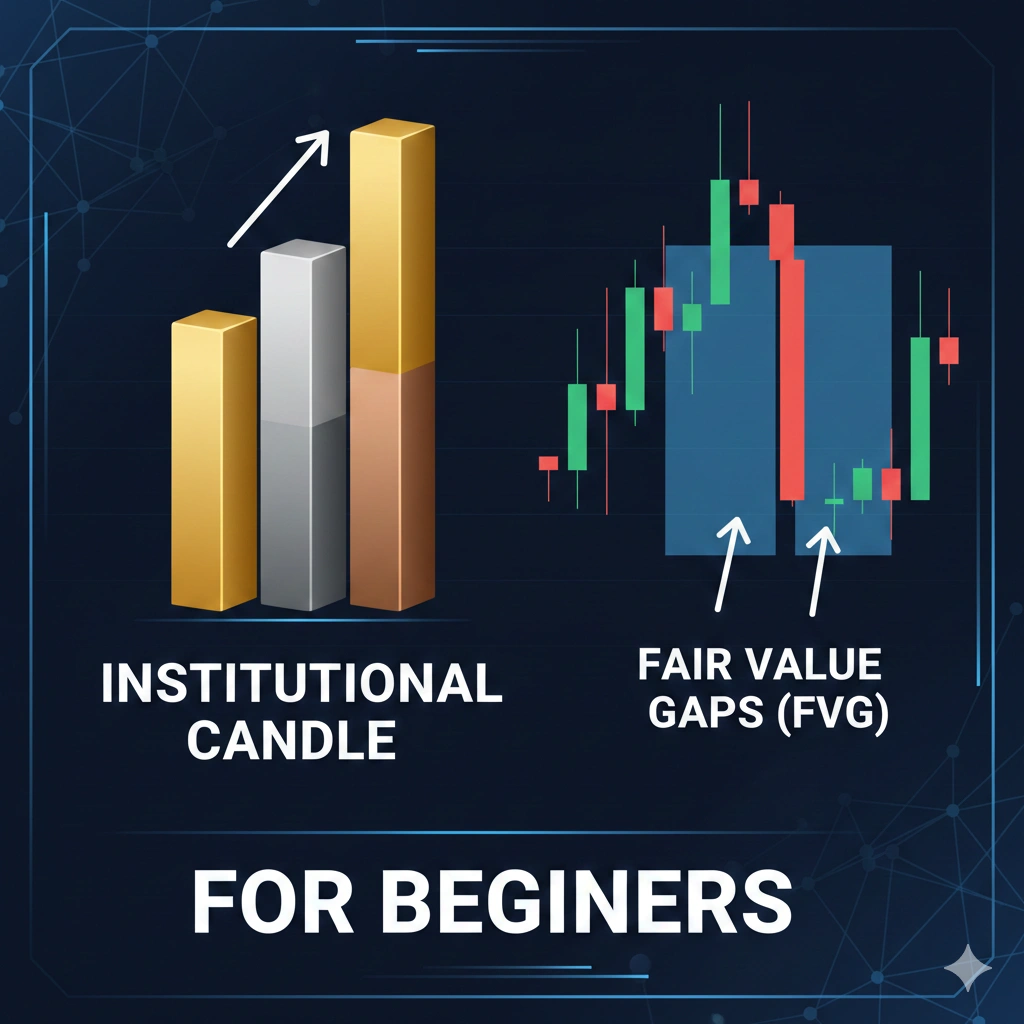
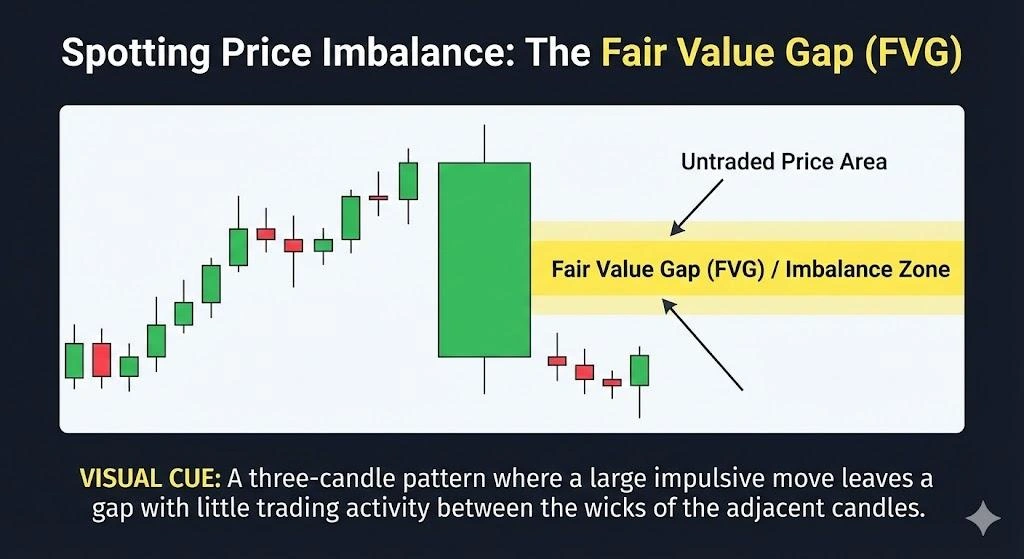
- Fair value gaps (FVG): The three-candle pattern reveals the trading zone where very limited trading activity happens. It’s the most common way to spot imbalance visually.
Why Imbalances Matter
Imbalances matter because the market’s information processing system needs to adjust prices when one side dominates the market. These inefficiencies are not random; they show exactly why supply and demand are out of sync. That’s the key concept in imbalance trading logic.
For traders, these imbalanced zones become high-interest areas for the future because:
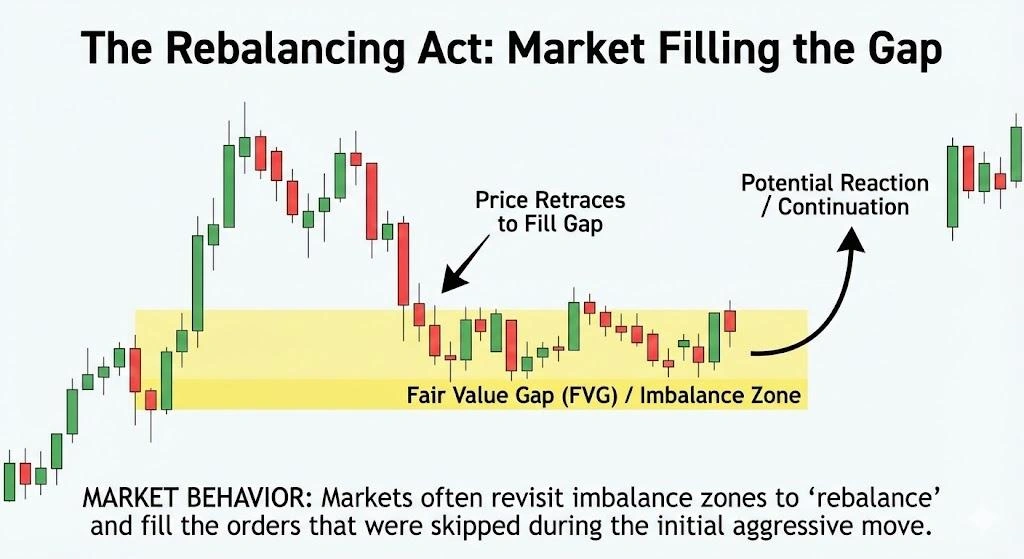
- Markets tend to revisit these specific price levels to achieve the order flow equilibrium.
- They often act like future obstacles that will affect market trends later.
- This shows the current most preferred sectors for investment by big institutions.
A Practical Framework: How Imbalance Trading Logic Works
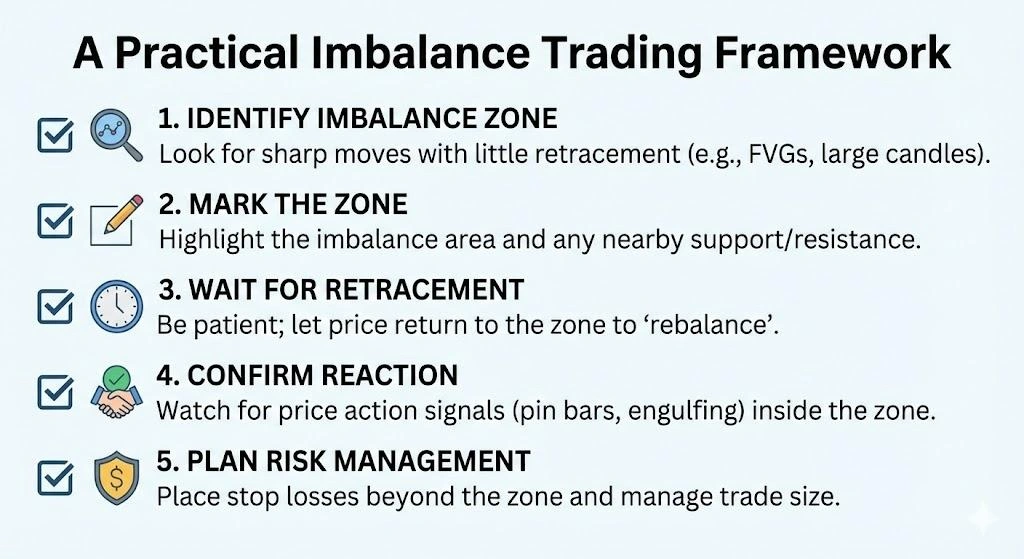
The following steps show how to use imbalance trading logic for trading:
1. Identify the Imbalance Zone
Identify the aggressive, one-sided moves which operate without any reversal These patterns include:
- Large candles that have very little overlap with each other.
- A clean fair value gap sitting between consecutive candles.
- Look for low-volume areas where very little trade took place.
2. Mark the Zone
Once you find these spots, mark them on your chart:
- Highlight the areas with highs or lows.
- Look for nearby support or resistance levels.
3. Wait for Retracement
Instead of chasing the move, wait for the price to return into your highlighted area. The logic behind this is that the market will eventually want to restore the market efficiency after fast market moves.
4. Confirm Reaction
Once the price falls back into the zone look for an actual entry:
- Monitor the pin bars, engulfing candles, or break in structure.
- Look for a sudden jump in volume to confirm big players are pushing again.
5. Plan Risk Management
- Place your stop losses just beyond the imbalance zone.
- Keep your trade size small to avoid any big loss.
Practical Example: Bullish Imbalance Setup
Suppose this on a EUR/USD 1-hour chart:
- The price moved so fast that it left a fair value gap between 1.0950–1.0970.
- The price drifted back a bit to collect the orders left behind.
- And when it hits the zone, it gets rejected instantly, showing that buyers are still in game.
A trader using imbalance trading logic:
- Marks the imbalance zone.
- Wait for the price to come back to you.
- Enter a trade with a stop-loss placed safely below the zone.
You aren’t just guessing that the price will go up; You are betting that because the price moved so fast at first time, it left that zone untraded initially.
Common Misunderstandings
- Imbalance Always Predicts Reversals
No, a gap just shows that the market was inefficient and might revisit that spot, but it doesn’t guarantee reversal. The price may maintain its present direction until it achieves its highest point in the short term. - Imbalance Does Not Guarantee a Fill
Price won’t always revisit these zones. They are simple signs that the market was inefficient, not a 100% promise of a reversal. - Indicators Alone Capture Imbalance
The current indicators fail to detect imbalances because they’re too slow and lag. Imbalance logic detects market irregularities through its analysis of price movement data and trading activity information.
Putting Imbalance Logic Into Trading Tools
In the current trading period, there are some great tools that can help you spot imbalances:
- Gap detector: It’s a simple indicator that highlights things like fair value gaps
- Volume profiles: This tool lets you see where the pressure is building up between buyers and sellers.
- Backtesting tools: This tool is perfect if you want to analyse old data to see how imbalance setups played out in the past.
Use these tools to enhance your knowledge and to explain your logic, but not as a final signal for an action.
Conclusion: Imbalance Trading Logic
Imbalance trading logic moves beyond superficial indicators to explain the actual dynamics of supply and demand that create price imbalance. The process of identifying Fair Value Gaps together with their market zone assignments helps traders understand what causes price fluctuations and how markets work to fix price imbalances.
This approach is all about logic and structure, rather than taking a guess. It helps you pick the right entry and exit for your trade based on how the market works with, keeping your risk management in mind.
For further explanation connect with InsightfulTrade. They offer expert guidance to help learn all the complex concepts of trading.
FAQs
- What platforms are helpful in imbalance trading logic?
The FVG indicators available through TradingView and MT5 platforms offer users vital trading resources. Volume profile or order flow tools provide additional information that you can use. - How does imbalance logic apply to Indian markets?
Of course, the concepts are the same for Indian forex or derivatives; just stick to your SEBI-regulated brokers. You’ll often see these imbalances show up on NSE/BSE futures charts. - Is trading based on imbalance actually legal?
Yes, it’s essentially just a market analysis. As long as you follow your country’s local rules and use a legitimate broker. - Is imbalance suitable for beginners?
Well, it’s a bit more advanced for beginners. But you can learn it first; start by spotting these zones, then work on adding risk management as you get confidence.
Author: Kumkum Chandak
Experience: 3+ Years in Trading Research & Market Content Strategy
Kumkum Chandak is a trading content strategist and market research writer who specializes in simplifying technical analysis, trading tools, and strategy-driven educational content. Her work is optimized for EEAT, accuracy, and user intent, ensuring every article delivers practical insights for traders of all levels.
Risk Disclaimer:
All content is strictly educational and not financial advice. Trading involves substantial risk. Always perform your own analysis or consult a professional advisor.
Last Updated: 17 January 2026