Index volatility measurement is the process of calculating how much a stock index fluctuates over a specific period using statistical tools like standard deviation or volatility indices such as VIX. When you were wondering why the markets WERE volatile at one point and then all at once, you were already thinking about the index volatility measurement.
Simply put, the volatility of index measures enables traders to know the degree to which index movement is likely to change over a given period. Following the volatility of indices and the volatility of measures data will enable you to better control risk and time entries and make wiser trading decisions without being caught in the middle of the market with a sudden change of direction.
Quick summary
| Topic | Cover |
| Index Volatility Measurement | Meaning & basics |
| Volatility Indices | VIX, VXMT overview |
| Index Movement | Causes of market moves |
| Tools & Calculators | Volatility tools |
| Use cases | Practical trading use |
What Is Index Volatility Measurement?
Let’s keep it super simple. The volatility of indexes measures the movement of the index within a certain time period. It indicates the consistency or high uncertainty of index movement.
There are three main types:
- Historical volatility – Previous index movement.
- Implied volatility – Expected future volatility based on volatility indices.
- Realized volatility – Real volatility, which is measured.
To put it briefly, the volatility of index measures makes you realize how risky the market is before the market surprises you.

What Are Volatility Indices?
Let’s keep it simple. Volatility of index measures is a tool that displays the extent to which an index movement is likely to vary. They do not give directional predictions; they give expected intensity.
Volatility indices examples.
| Volatility index | Timeframe | Tracks |
| VXN | Short-term | NASDAQ-100 volatility |
| VSTOXX | European market | Euro Stoxx 50 volatility |
| VIX | 30 days | S&P 500 volatility |
Why Index Volatility Measurement Matters
It is time to stick to the point – index volatility measurement is the tool that helps you to realize how risky the next index movement may be. It’s not just numbers. It’s preparation.
-
Better Risk Control
An increased volatility index means increased risk.
You can:
- Reduce position size
- Adjust stop-loss
- Hedge smartly
-
Smarter Trade Timing
The increase in volatility of index measures is usually an indication of increased future index action, breakouts, or deep declines.
-
Clear Market Sentiment
- High volatility = fear
- Low volatility = stability
Concisely, volatility of index measures can help you prepare rather than respond too late.
How Index Movement Affects Trading Decisions
Simple reality – index movement makes your trades, and index volatility measure tells you how intense that index action may be.
Important Motivations to Index Movement.
- Economic releases of economic data, GDP, CPI, and jobs can raise the index volatility measurement immediately.
- Decisions in the monetary policy- interest rate increase or decrease change the risk appetites quickly.
- Any geopolitical event, such as elections, world political tensions, and trade agreements, all affect the volatility of indices.
- Market psychology: Fear and greed are two very important factors that impact index movement.
- Sector rotation – Money moves out of tech, energy, and finance switch index.
What will happen in the case of the Index Movement Spike?
Index volatility is increased when the index action becomes sharp. That’s your early warning.
For example:
- The VIX is normally driven by type with a sharp fall.
- Volatility of indices tends to remain at a low level due to a continuous increasing trend.
Traders, instead of responding emotionally, use the index volatility measurement to
- Reduce risk
- Hedge positions
- Prepare for breakouts
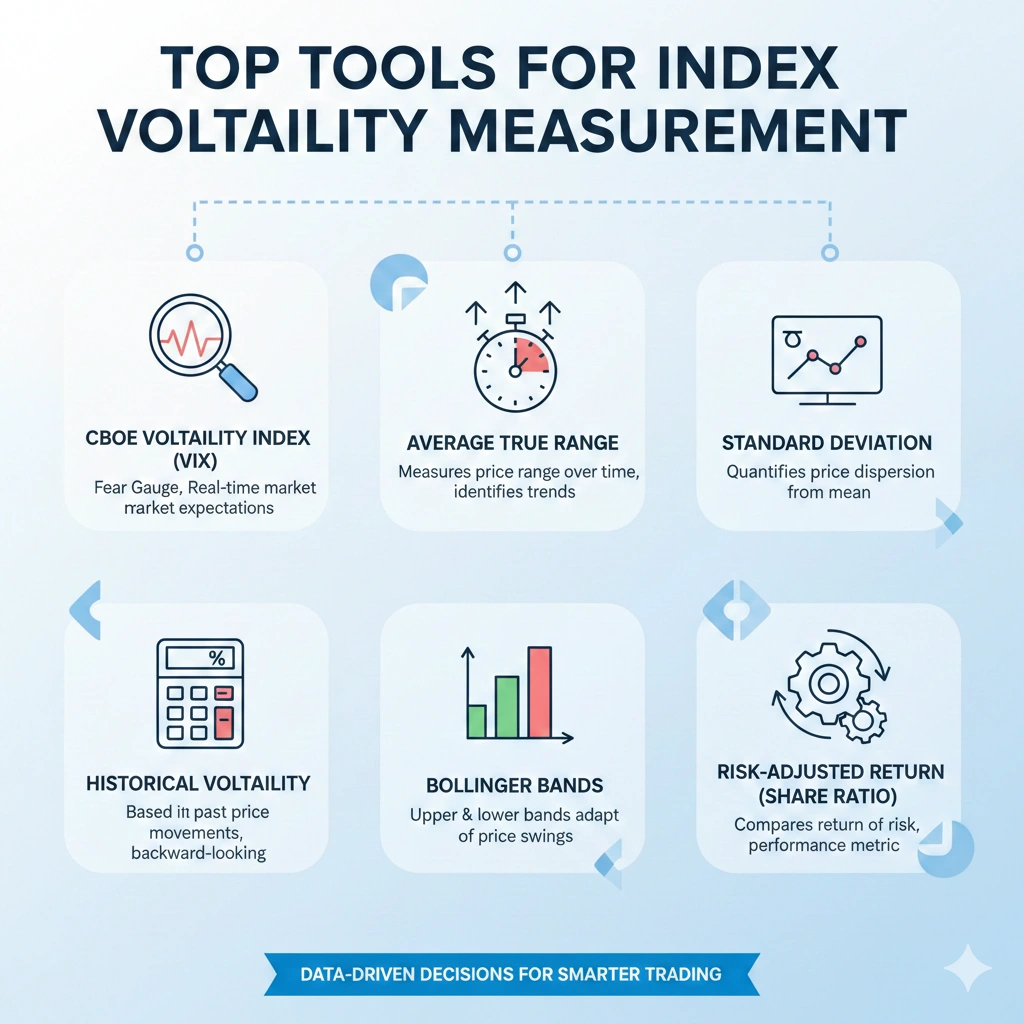
Top Tools for Index Volatility Measurement
Let’s keep it quick. It requires instrumentation that will clearly track index action to properly make volatility of the indexes.
-
Volatility Calculators
To calculate historical and implied volatility, they use:
- Standard deviation
- Bollinger Band® width
- GARCH models
Features to Look For
- Custom time periods
- Implied volatility support
- Multi-index tracking
- Exportable reports
- Real-time volatility alerts
Trading Tools & Calculators That Elevate Volatility Analysis
Let’s keep it simple. The tools are right, and index volatility can be measured and implemented now, not merely being an idea.
-
Charting Platforms
They incorporate index action and volatility instruments such as:
- Bollinger Bands®
- ATR (Average True Range)
- The overlays of the historical volatility.
- You have price and volatility at the same time.
- Option Premium Calculators
These assist in gauging implied volatility and monitoring volatility of index changes.
They show:
- Expected volatility
- Option pricing shifts
- Unpriced contracts or overpriced contracts.
-
Risk & Portfolio Tools
They compute overall portfolio volatility and also display the effect of individual assets on overall risk.
-
Scanner & Alert Tools
They track the volatility of indices and throw off alarms when there is a spike in index movement.
Concisely, the right trading tools & calculators make the volatility of indexes smarter in trading decisions.

A Step-by-Step Guide to Measuring Index Volatility
The measurement of index volatility is as simple as follows.
- Choose Your Index- e.g., S&P 500 or NASDAQ.
- Select Time Frame- daily, weekly, or monthly.
- Get Price Data – historical prices to be used.
- Standard Deviation Compute – greater = more volatile.
- Draw a Volatility Graph- visualize index movement.
- Compare With Volatility Indices – VIX, VXMT, etc.
- Set alerts – monitor drops or spikes.
Example Calculation:
Assume S&P 500 daily returns have a standard deviation of 1.5%.
Annualized volatility = 1.5% × √252
= 1.5 × 15.87
= 23.8% annual volatility
To the point, these steps render the volatility of index measures understandable, rapid, and implementable.
Real-World Use Cases for Index Volatility Measurement
The following is the actual trading of index volatility.
1. Rebalancing of portfolios, which is risk-aware.
- Minimize exposure to volatility spikes.
- Add defensive assets
- Position for mean reversion
2. Options Trading
- Price options accurately
- Structure spreads
- Identify overpriced or underpriced portfolios.
3. Timing Entries & Exits
- Sudden spikes = panic selling
- Gradual rise = trend momentum
To the point, the volatility of index measures assists you in trading and investing better.
Faqs
1. What is the best tool for measuring index volatility?
The ideal tool is based on the trading style. To have real-time measurements, charting systems that include volatility indicators (such as ATR and Bollinger Bands 2) are perfect. Option-based calculators are effective in the case of implied volatility.
2. How do volatility indices affect index movement analysis?
Volatility of indices will give a picture of future volatility, which is a predictive indicator of the future index movement.
3. Can volatility calculators predict market crashes?
It is not possible to have crashes that are predicted with 100 percent confidence by any tool. However, volatile calculators have the potential to announce increasing risk levels that could lead to massive index changes.
4. Are historical and implied volatility equally useful?
Yes, but to other ends. Volatility is historical and implied, which are past and future price behaviors, respectively.
5. How often should I check volatility measurements?
It depends on your strategy. Day traders can check several times in a day, whereas long-term investors can check the trends of a week or a month.
Conclusion
In conclusion, every trader or investor must have an index volatility measurement to ensure that he or she keeps pace with market moves. Taking volatility indices, tracking index movement, and taking the right tools and calculators, you can manage risk, time trades, and make more intelligent decisions. When index volatility is measured properly, you are not responding, you are ahead of the curve.
Ready to master index volatility measurement? Find out the best volatility indices, real-time calculators, and smart trading tools at Visit InsightfulTrade today to make informed decisions and be ahead of the market fluctuations!
Author: Arihant Jain
Trading Experience: 5+ Years
Arihant Jain is a financial markets analyst and trading educator with expertise in Forex, indices, crypto, and risk-managed trading systems. His insights are based on real trading experience, data-driven analysis, and transparent market understanding. All content is reviewed for accuracy and aligns with Google’s EEAT guidelines.
Risk Disclaimer:
Trading involves substantial risk. All information is for educational purposes only and should not be taken as financial advice. Always do your own research.
Last Updated: 17 February 2026