A strategic and disciplined capital distribution is the secret of every successful trader’s longevity. The concept of margin is very important when you’re trading big indices like the NAS100, US30 or S&P500. And you shouldn’t pick indices based on the vibe or your preference about a sector, it is a strategic decision based on the fact whether your account can handle it.
An effective index margin comparison allows you to see past the price action and understand the actual cost of entry. In this blog, we’ll study the mechanics of index trading, the practical method you can use to compare index margins properly and determine which index fits best for your account size and risk appetite.
Understanding the Fundamentals of Index Margin
Before trading any financial instrument it is important for you to know what the margin is. Margin acts like a collateral when you want to borrow some money from your broker. Because indices are very expensive stocks, and not everyone has that much amount lying to risk. In such cases the Leverage allows you to trade to big positions with a small margin.
Further there are two primary types that you should know:
- Initial Margin: It’s a specific amount of free cash that you must have in account in order to open a new position, it protects the broker in case you lose all the money.
- Maintenance Margin: This is the minimum equity balance you must maintain to keep the trade open; falling below this level often results in an automatic liquidation.
Understanding these requirements is vital because different indices have different price-weighting structures. For example, the US30 decides its stock price by the price tag, while the NAS100 and S&P 500 count them by the size of the company. A little change in detail can change the amount required for you to enter a trade.
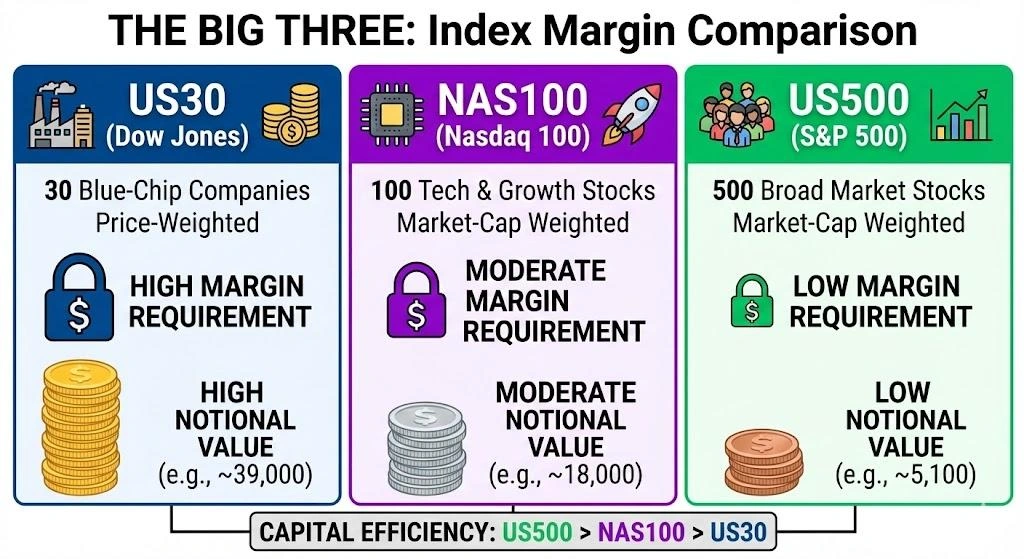
The Big Three: An Index Margin Comparison
To conduct a meaningful analysis, we must look at the unique personality and mathematical structure of the three most popular US indices. While they often move in tandem, their capital requirements vary significantly.
1. The Dow Jones (US30)
The US30 tracks 30 of the largest blue-chip companies in the United States. It is often the most expensive index to trade from a margin perspective due to its high numerical value.
- High Notional Value: Because the US30 trades at a high price (e.g., 38,000+), if it moves even 1% that’s a lot of money you are gaining or losing in a single trade.
- Sizing Constraints: If your account size is very small then you won’t have any emergency cash lest after opening just one trade.
2. The Nasdaq 100 (NAS100)
The NAS100 is the benchmark for technology and growth stocks. In any us30 nas100 margin guide, the Nasdaq usually occupies the middle ground.
- Volatility Adjustments: when giant tech companies announce their earnings, NAS100 can rise fast.leading to the brokers increasing the margin during that time.
- Moderate Entry Cost: Though it’s cheaper, but because it moves faster, it risks you money faster than other indices.
3. The S&P 500 (US500)
The S&P 500 is the broadest benchmark of the US economy. It is generally the most “margin-friendly” index for retail traders.
- Capital Efficiency: Here you don’t need much margin, because the index value is lower (e.g., 5,000) as compared to US30.
- Precision Scaling: The S&P 500 allows you to trade small positions, making it ideal for traders who want to scale into positions without exhausting their free margin.
Index Margin Comparison: The Mathematical Breakdown
To truly understand the margin difference between indices, we need to look at a practical calculation. Most brokers offer leverage ranging from 1:20 to 1:500 depending on your jurisdiction and classification. For this us30 nas100 margin guide, let’s assume a standardized leverage of 1:100 to illustrate the differences.
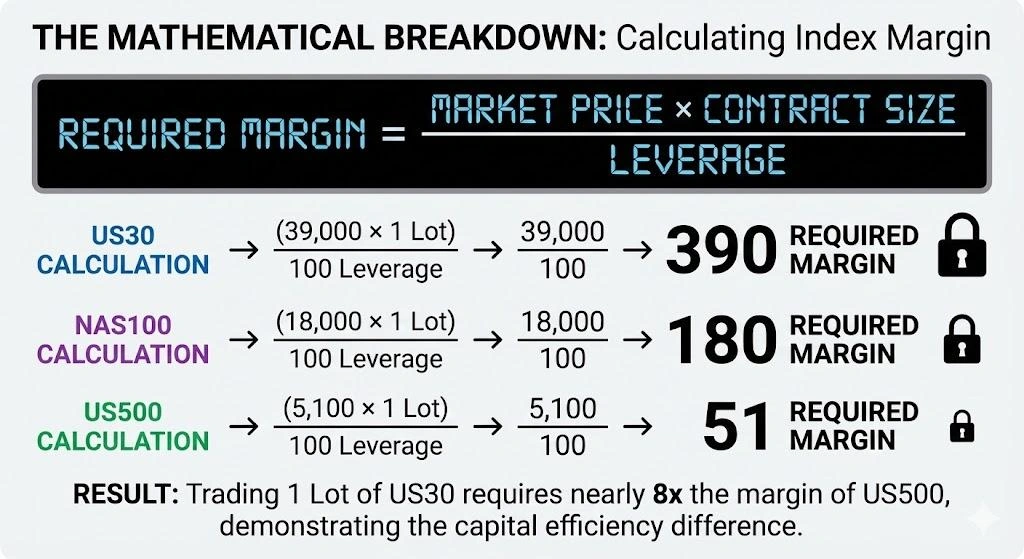
The Calculation Formula
The formula to calculate the required margin is:
Required Margin = (Market Price × Contract Size) / Leverage
Comparison Example
Imagine the following market prices:
- US30: 39,000
- NAS100: 18,000
- S&P 500: 5,100
If you trade 1 standard lot (where 1 lot = $1 per point) with 1:100 leverage:
- US30 Margin: (39,000×1) / 100 = 390
- NAS100 Margin: (18,000×1) / 100 = 180
- S&P 500 Margin: (5,100×1) / 100 = 51
This index margin comparison clearly shows that trading the Dow Jones requires nearly eight times the capital of the S&P 500 for a single lot. This is a crucial insight for traders who might mistakenly apply the same lot sizes across all three indices without adjusting for the underlying notional value.
How to Use an Index Margin Comparison Tool
Most professional platforms provide an index margin comparison tool or calculator. To use these effectively, follow this workflow:
- Select Instrument and Currency: Choose your index (US30, NAS100, or S&P 500) and make sure that account balance matches with the required margin for that particular index.
- Input Leverage: Use the specific leverage offered for indices, which is often lower than the leverage offered for Forex pairs.
- Set Trade Size: Decide the size of position (Lots/Units), to see how much the trade will cost you.
- Analyze Free Margin: It’s an important one. Never use more than 5–10% of your account balance on single trade.
The Impact of Volatility on Margin Requirements
An often-overlooked aspect of an index margin comparison is that margin is not static. Brokers reserve the right to increase requirements during high-impact events.
- Dynamic Margin Shifts: During FOMC meetings or Non-Farm Payroll (NFP) releases, brokers may cut leverage from 1:100 to 1:50, effectively doubling your required margin overnight.
- Weekend Gaps: Holding positions over the weekend requires extra “margin cushion,” as indices can gap past your stop loss, leading to a margin call.
- Risk-Adjusted Sizing: High-volatility indices like the NAS100 should generally be traded with lower leverage to compensate for the higher probability of rapid price swings.
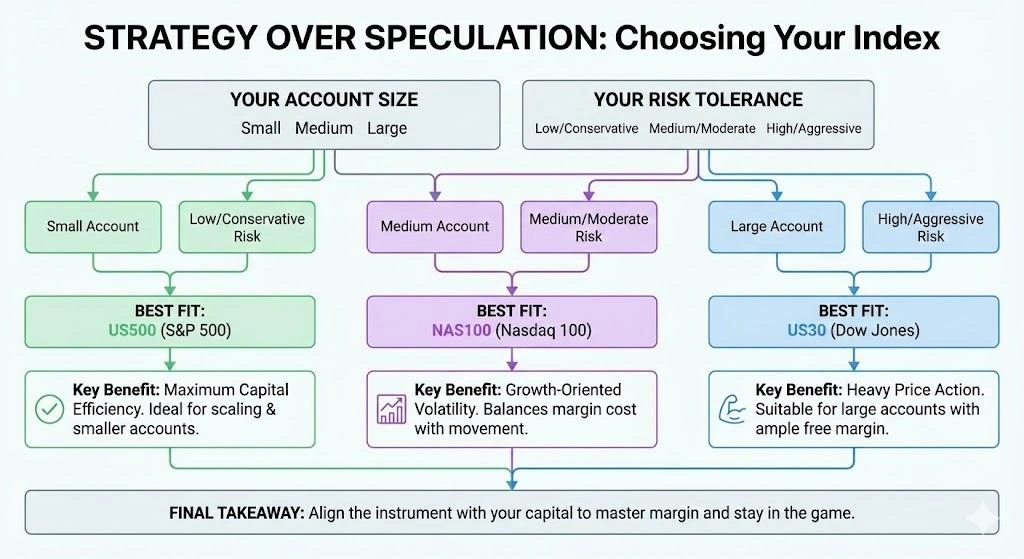
Conclusion: Strategy Over Speculation
At the end of the day, conducting a thorough index margin comparison is the most crucial step of trading. If you don’t understand that the US30, NAS100, and S&P 500 require different levels of capital, then you’re setting yourself for early exits. The S&P 500 offers the best capital efficiency, the NAS100 provides growth-oriented volatility, and the US30 offers heavy price action for larger accounts.
To master the art of index margin calculations, understand how to compare them and include them in your strategy to achieve long-term success. Visit InsightfulTrade’s website where we provide the education and tools necessary to navigate these complex markets with confidence.
FAQs
- What is an index margin comparison tool?
It compares margin requirements across indices to help traders manage risk. - Can margin calculators differ by broker?
Yes, leverage and contract size vary between brokers. - Is manual margin calculation reliable?
It’s useful for learning, but tools are more accurate for live trading. - Which index usually requires the highest margin?
US30 often requires a higher margin due to volatility. - Should beginners rely on margin tools?
Absolutely—margin tools are essential for capital protection.
Author: Kumkum Chandak
Experience: 3+ Years in Trading Research & Market Content Strategy
Kumkum Chandak is a trading content strategist and market research writer who specializes in simplifying technical analysis, trading tools, and strategy-driven educational content. Her work is optimized for EEAT, accuracy, and user intent, ensuring every article delivers practical insights for traders of all levels.
Risk Disclaimer:
All content is strictly educational and not financial advice. Trading involves substantial risk. Always perform your own analysis or consult a professional advisor.
Last Updated: 21 December 2025