Introduction to Bollinger Bands in Forex Trading
Technical indicators play an essential role in helping forex traders understand market conditions, identify trends, and discover potential trading opportunities. Among the numerous indicators available, the Bollinger Bands strategy remains one of the most popular and versatile approaches used by traders worldwide. Developed by John Bollinger in the 1980s, Bollinger Bands provide valuable insights into price behavior, volatility, and potential market reversals.
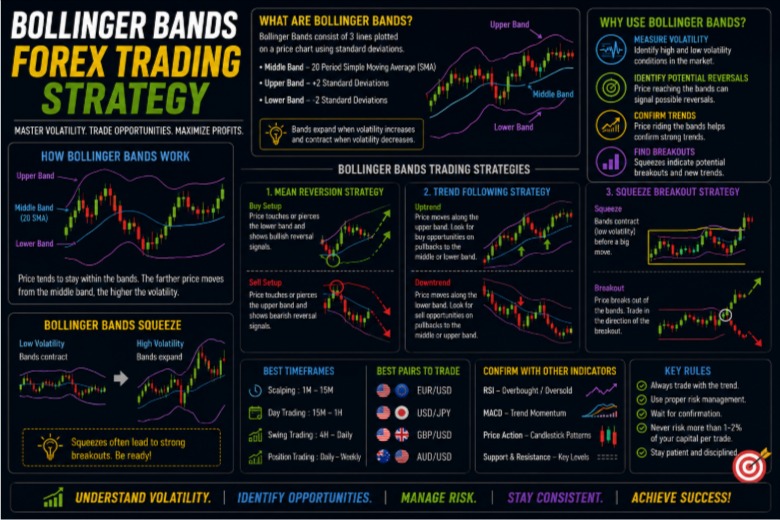
The Bollinger Bands strategy consists of three lines plotted on a price chart. The middle line is typically a 20-period moving average, while the upper and lower bands are positioned a specific number of standard deviations away from that average. These bands expand and contract based on market conditions, providing traders with a dynamic view of price movement.
One of the reasons traders favor this indicator is its flexibility. Bollinger Bands can be used in trending markets, ranging markets, and volatile environments. When combined with proper analysis and risk management, this approach can significantly improve trading consistency.
Understanding how to use Bollinger Bands effectively requires more than simply buying when price touches the lower band or selling when price reaches the upper band. Successful implementation depends on understanding volatility, market context, and confirmation techniques.
Understanding the Components of Bollinger Bands
A proper understanding of the Bollinger Bands strategy begins with learning its core components.
The middle band represents the market’s average price over a specific period and often acts as dynamic support or resistance. The upper and lower bands measure market dispersion and adjust automatically as price fluctuations increase or decrease.
During periods of strong price movement, the bands widen to reflect increasing volatility trading conditions. Conversely, during quiet market phases, the bands contract as volatility declines.
This dynamic behavior makes Bollinger Bands particularly useful because traders can visually assess changing market conditions without relying on multiple separate indicators.
Understanding how these components interact forms the foundation for applying the Bollinger Bands strategy effectively.
The Relationship Between Volatility and Bollinger Bands
One of the greatest strengths of Bollinger Bands is their ability to measure volatility trading conditions.
Volatility refers to the degree of price fluctuation within the market. High volatility generally results in wider Bollinger Bands, while low volatility causes the bands to narrow.
Many traders specializing in volatility trading closely monitor periods when the bands contract significantly. These contractions, often called squeezes, frequently precede major price movements.
Recognizing changing volatility conditions helps traders prepare for potential breakouts and adapt their strategies accordingly.
By incorporating volatility analysis into decision-making, traders can improve trade timing and better manage risk.
Why Technical Analysis Matters
No indicator should be used in isolation. Effective technical analysis remains essential when applying Bollinger Bands in forex markets.
Technical analysis involves studying historical price movements, chart patterns, and market structure to identify potential trading opportunities. Bollinger Bands complement technical analysis by providing additional information regarding volatility and price extremes.
For example, support and resistance levels, trendlines, and candlestick patterns often enhance the reliability of Bollinger Band signals.
Integrating technical analysis with indicator-based approaches helps traders avoid false signals and develop more comprehensive market perspectives.
Successful traders understand that technical analysis provides context, while indicators offer confirmation.
Using Bollinger Bands in Trending Markets
Although Bollinger Bands are frequently associated with reversal trading, they can also be highly effective during strong trends.
In trending environments, price often rides along the upper or lower band for extended periods. Many inexperienced traders mistakenly interpret every touch of the outer band as an immediate reversal signal.
However, a properly executed Bollinger Bands strategy recognizes that strong trends can maintain momentum despite overextended conditions.
During bullish trends, price may repeatedly test the upper band while continuing higher. In bearish trends, price may remain near the lower band for prolonged periods.
Understanding trend behavior prevents premature countertrend trading and supports more disciplined decision-making.
Mean Reversion and Bollinger Bands
One of the most common applications of the Bollinger Bands strategy involves mean reversion trading.
Mean reversion assumes that price tends to return toward its average after becoming excessively extended. Since the middle Bollinger Band represents an average price, traders often anticipate price retracements following extreme moves.
In a mean reversion environment, traders may look for opportunities when price reaches the outer bands and exhibits signs of exhaustion.
However, mean reversion strategies require confirmation because strong trends can invalidate reversal expectations.
Patience and proper market assessment remain essential when implementing mean reversion techniques.
Identifying Forex Indicator Confluence
Successful trading often depends on confluence rather than relying on a single signal. Combining Bollinger Bands with other forex indicators can significantly improve trade quality.
Momentum oscillators such as the Relative Strength Index or Stochastic Oscillator frequently complement Bollinger Bands effectively.
For instance, when price touches the lower Bollinger Band while momentum indicators indicate oversold conditions, the probability of a bullish reversal may increase.
Similarly, bearish divergence appearing alongside upper band interaction can strengthen reversal scenarios.
Using multiple forex indicators helps traders filter weaker setups and increase confidence in trading decisions.
Volatility Trading With Bollinger Band Squeezes
The Bollinger Band squeeze is among the most popular volatility trading techniques.
A squeeze occurs when the upper and lower bands contract significantly, indicating unusually low market volatility. Periods of low volatility often precede substantial price expansion.
Traders monitor squeezes closely because breakout opportunities frequently emerge shortly afterward.
However, the direction of the breakout cannot be predicted solely by the squeeze itself. Confirmation through technical analysis and price action remains necessary.
Successfully trading squeezes requires patience, discipline, and careful risk management.
Combining Technical Analysis With Mean Reversion
The integration of technical analysis and mean reversion significantly strengthens reversal trading approaches.
Rather than entering trades solely because price reaches an outer band, traders should evaluate broader market conditions.
Support and resistance zones, candlestick patterns, and trend direction provide valuable context for mean reversion opportunities.
For example, a bullish engulfing candle forming near major support while price touches the lower Bollinger Band may represent a stronger setup.
Combining technical analysis with mean reversion improves trade selection and reduces false signals.
Using Forex Indicators for Confirmation
Many traders enhance their Bollinger Bands strategy by incorporating additional forex indicators.
Moving averages help determine overall trend direction, while momentum indicators measure market strength.
Volume indicators may also provide insight into breakout validity during volatility trading environments.
However, excessive reliance on numerous forex indicators can create confusion and conflicting signals.
The objective should be confirmation rather than complexity.
A simple yet structured approach often produces superior results.
Common Mistakes When Using Bollinger Bands
Despite their popularity, traders frequently misuse Bollinger Bands.
One common mistake involves assuming that price touching the upper or lower band automatically signals reversal.
Another error occurs when traders ignore prevailing market trends while focusing exclusively on band interactions.
Some traders also neglect broader technical analysis and rely solely on indicator signals.
Additionally, applying mean reversion strategies during strong trending conditions often produces unnecessary losses.
Recognizing these mistakes can significantly improve trading performance.
Risk Management in Bollinger Bands Trading
No trading methodology guarantees success. Consequently, risk management remains essential.
Even high-quality setups occasionally fail, making capital preservation a priority.
Position sizing should reflect account size, market conditions, and acceptable risk levels.
During periods of elevated volatility trading activity, traders may need to adjust stop-loss distances accordingly.
Strong risk management ensures long-term sustainability regardless of short-term outcomes.
Developing a Complete Bollinger Bands Strategy

A successful Bollinger Bands strategy combines several important elements.
Traders should first identify prevailing market conditions through technical analysis. Next, they should evaluate volatility levels and determine whether trending or mean reversion conditions are present.
Additional forex indicators may then be used for confirmation.
Finally, traders should define risk parameters before entering positions.
This structured process promotes consistency and reduces emotional decision-making.
Psychological Discipline and Consistency
Trading success depends not only on technical knowledge but also on psychological discipline.
Patience is especially important when using Bollinger Bands because high-quality opportunities do not appear continuously.
Traders should avoid forcing trades and remain committed to predefined rules.
Consistency in execution often proves more valuable than attempting to capture every market movement.
Maintaining discipline supports long-term trading success.
Conclusion
The Bollinger Bands strategy remains one of the most versatile and effective tools available to forex traders. By understanding volatility trading conditions, applying mean reversion principles appropriately, incorporating complementary forex indicators, and conducting thorough technical analysis, traders can significantly improve market performance.
While no strategy guarantees profits, a disciplined and structured approach allows traders to use Bollinger Bands effectively across a wide range of market environments. With patience, proper risk management, and continuous learning, Bollinger Bands can become a valuable component of a comprehensive forex trading plan.