Quick Summary
A strategy that is used by traders like you to identify the low price movement periods before explosive breakouts. If you recognize consolidation zones, it will be helpful to prepare for high-probability trades. Today, in this guide, we are going to explore:
- What volatility compression trading is and why does it matters
- How can you identify volatility compression zones
- Step-by-step strategies
- Pro tip for traders and some common mistakes
- Pros and cons of volatility compression trading

What Is Volatility Compression Trading?
It is that period when the asset price moves in a narrow range and indicates market indecision. Do you know what happens during these periods?
- Pip movement is minimal
- Candlestick size shrinks
- Momentum indicators flatten
It gives a signal of market activity, so you need to monitor it closely because they often precede breakouts or sharp trends.
Looking for an example, a currency pair of EURUSD trading between 1.0700 and 1.0720 for several hours demonstrates compression. If you recognize these zones, you’re allowed to prepare for enhancing risk management and prepare for potential price surges.
Why Does Volatility Compression Happen?
Want to know the reason why this happens? This phase is extremely important for you because it forms the foundation of high-probability breakout trades. It occurs due to:
- Market Indecision builds up
- Support and Resistance Clusters
- Decreasing Trading Volume
- Institutional order accumulation
- Liquidity drying temporarily
- Upcoming economic news or events
How Can You Identify Volatility Compression Zones?
Volatility compression is not a random behavior. It is a natural part of how financial markets prepare for large moves. Here’s how you can identify it effectively:
- Look for Tight Price Ranges
- Check Bollinger Bands on ATR
- Observe Volume Patterns
- Identify Support and Resistance Levels
- Multiple Time Frame Analysis
Can Volatility Compression Trading Work in Indices Like US30?
Yes, it is ideal for volatility compression strategies. The reason is Index has predictable swings, high liquidity ensures reliable candle patterns, and compression often precedes strong breakout moves.
As an illustration, US30 consolidates at 33,500-33,520 for 2 hours. A breakout above 33,520 could reach more than 33,600 within 1 hour.
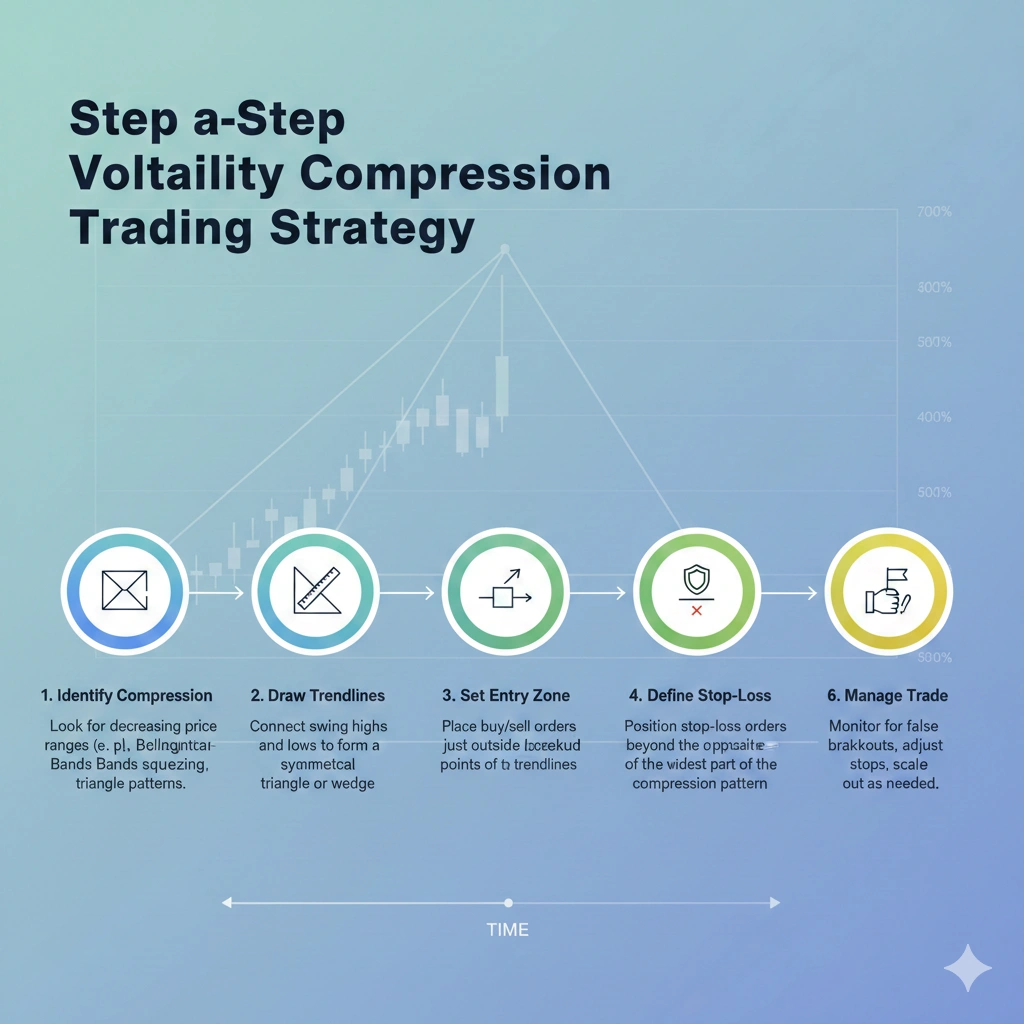
Step-by-Step Volatility Compression Trading Strategy
Step 1: Identify Consolidation
Step 2: Market Support and Resistance
Step 3: Set Entry Orders
Step 4: Determine Risk-Reward Ratio
Step 5: Monitor Breakout Confirmation
Example table for Risk-Reward Ratio
| Trade Type | Entry | Stop Loss | Target | Lot Size | Pip Risk | RR |
| Buy EURUSD | 1.0821 | 1.0805 | 1.0850 | 0.1 | 16 | 1:1.8 |
| Sell EURUSD | 1.0795 | 1.0810 | 1.0760 | 0.1 | 15 | 1:2 |
What Are the Benefits of Volatility Compression Trading?
It can prove beneficial when used correctly, which can improve both trading accuracy and overall consistency. Let’s quickly go through the benefits:
- High-probability breakout opportunities
- Precise and controlled risk management
- Excellent risk-reward ratios
- Work across multiple markets
- Builds consistency and confidence
- Suitable for all trading styles
- Clear trade planning and reduced emotional trading
Which Indicators Best Support Volatility Compression Trading?
Looking for the best indicators? Here are some of the most reliable that can help you effectively:
-
Bollinger Bands
One of the most effective tools to spot volatility compression. At the time of the band’s contract and move getting closer together, it shows that price volatility is decreasing.
-
Average True Range
To measure market volatility, it can be helpful. If ATR declines, it suggests compression, and with the sudden rise, it confirms the start of a breakout.
-
Keltner Channels
It is useful for spotting compression zones, and you can say it is similar to Bollinger Bands. It highlights the phases with low volatility.
-
Volume Indicators
It plays a vital role in validating compression setups and gives traders an early directional bias and strong confidence in trade entries.
What Are Common Mistakes in Volatility Compression Trading?
It is a powerful strategy, but still many traders lose money simply because they made mistakes that could have been avoided. Here are the mistakes, and avoiding these can result in improving your consistency and protecting your capital:
- Entering before breakout confirmation
- Ignoring the higher-timeframe trend
- Using improper stop-loss placement
- Trading during high-impact news
- Ignoring volume confirmation
- Overtrading every small range
How to Calculate Risk and Reward in Volatility Compression Trades?
If you calculate, it can help you to protect capital and maintain consistency. First of all, identify the range of compression using resistance levels and clear support. Risk calculation becomes more important because price often breaks out sharply from tight ranges, especially during periods of low volatility before news events. Here’s the formula:
Formula:
Risk per trade = Entry Price – Stop Loss * Lot Size * Contract Size
How to Combine Volatility Compression With Other Trading Techniques?
If you combine volatility compression with other techniques, it can reduce the false breakouts and improve accuracy in your trade. You can start it with identifying market structure, then higher timeframe trend bias, adding volume confirmation and liquidity session, and waiting for the strong candlestick confirmation. It will help you by turning compression into a high-probability trading strategy.
Pros and Cons of Volatility Compression Trading
Pros
- High-probability breakout trades
- Precise risk management
- Works across multiple markets
- Support multiple timeframes
Cons
- False breakouts can happen
- Requires patience and timing
- Needs continuous monitoring
- The market can remain in compression for a long time.

FAQs on Volatility Compression Trading
- How long does a volatility compression last?
It depends on the timeframe and market condition, but generally it can last from a few minutes to several hours.
- Can I trade volatility compression without indicators?
Yes, it can be done with price action. You can identify compression areas effectively if you focus on repeated small candles, tight ranges, and resistance zones.
- Is volatility compression trading risky?
This strategy also carries risk, just like others. But you can use stop-loss placement and disciplined risk-reward rules to make it more consistent and safe.
- Which markets are best for volatility compression?
It works best in highly liquid markets and pairs like EURUSD, GBPUSD, and USDJPY are generally considered excellent because of strong institutional participation and tight spreads.
- Can small traders use this strategy effectively?
Yes, it is ideal for beginners and works very well with micro and mini lot sizes.
Final Tips for Traders
Here are some tips for you; if you master these tips, you can transform compression zones into consistent profit opportunities. Let’s check what these are:
- Always respect the compression zone
- Wait for the candle close confirmation
- Trade in the direction of the higher-timeframe trend
- Keep stop-loss tight and logical
- Avoid trading during major news unless experienced
- Track your compression trades in a journal
- Quality over quantity
- Use partial profit booking
Conclusion
Being a trader, you have definitely noticed that sometimes the market just goes quiet and everything looks boring. Recognizing these tight zones will help you stop chasing the random moves and start preparing for high-probability breakouts.
You can turn periods of indecision into profitable opportunities by understanding consolidation patterns, managing risk effectively, and using proper indicators. The simplicity of this strategy is very real, and the thing you have to do is just be patient and have disciplined risk management.
Turn the quiet market into strong market opportunities and learn how to master volatility compression trading only on InsightfulTrade. So be a smart trader, stay patient, and just let the market come to you!
Author: Arihant Jain
Trading Experience: 5+ Years
Arihant Jain is a financial markets analyst and trading educator with expertise in Forex, indices, crypto, and risk-managed trading systems. His insights are based on real trading experience, data-driven analysis, and transparent market understanding. All content is reviewed for accuracy and aligns with Google’s EEAT guidelines.
Risk Disclaimer:
Trading involves substantial risk. All information is for educational purposes only and should not be taken as financial advice. Always do your own research.
Last Updated: 07 January 2026