Introduction: Why Measure Market Volatility?
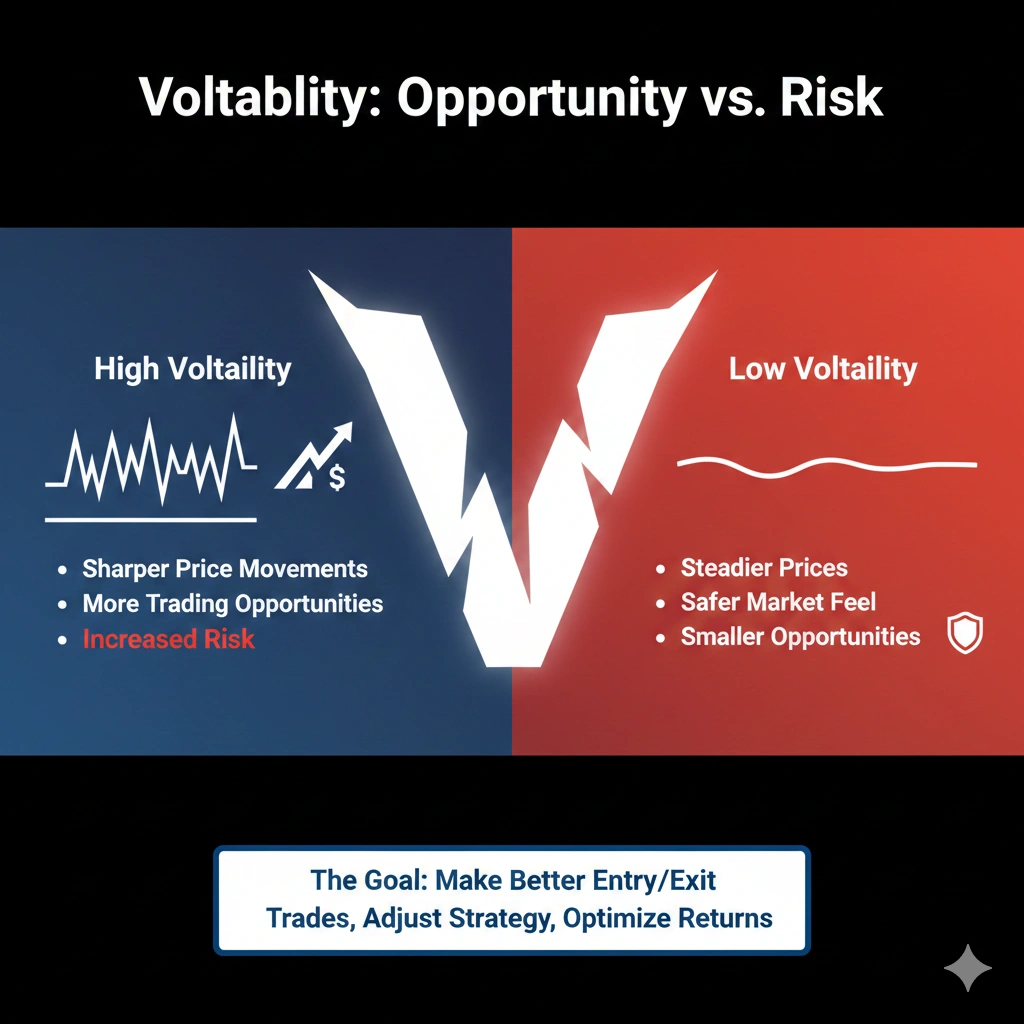
Measuring market volatility means looking at how much and how fast prices move up and down. It gives you a better understanding about how the volatile market works, with high volatility in the market the price movements become sharper giving you more opportunities and also increased risk. But in low volatility the prices are steadier, so the market feels safer though opportunities might be smaller.
By calculating the volatility of the market, you get an estimate beforehand, and that helps you make better entry or exit trades, how much to invest, and what strategies to use. It also affects pricing for options and helps create balanced portfolios.
As a trader in forex and indices, you need good timing and strategy adjustments to maximize profits on price swings and avoid unnecessary risk. Monitoring the market volatility beforehand helps you achieve that. Overall, by measuring volatility you stay informed, avoid uncertainty, optimize returns, and protect your investments effectively.
What Is a Volatility Calculator Trading?
Well the concept of a volatility calculator is quite simpler than it sounds. Think of it as your market mood reader—showing how much prices wiggle over time. Traders use this tool to see the risk level before making moves.
The main work of a volatility calculator is to look at past price data, mostly daily closing prices, and analyze those numbers to give you volatility scores. These scores will tell you if the market or a currency pair has been calm or jumpy.
Key points about volatility calculators:
- Use historical price data to calculate volatility
- Most calculations rely on the standard deviation of returns
- Help with index volatility measurement for stocks and ETFs
- Vital for a reliable forex volatility guide in currency trading
- Available as apps, online tools, or built into trading platforms
- Support risk management by showing potential price swings
- Include measures like historical volatility and implied volatility
- Help set stop-loss, position sizing, and entry/exit timing
With the use of a volatility calculator trading tool you can form more data-driven strategy, reducing guesswork and boosting confidence.
Methods of Measuring Market Volatility
Volatility isn’t a one-size-fits-all number. Traders use multiple methods to measure it, each offering a unique view on how prices fluctuate. Understanding these methods helps you interpret what your volatility calculator shows and apply it effectively.
Historical Volatility
Historical volatility works backward looking at the past price movements in small periods –like 14, 30, or 60 days. This tells you how much prices have actually moved recently.
- Based on past price data
- Calculated using standard deviation formula
- Shows how much prices moved historically
- Helps in spotting patterns and trends
Implied Volatility
Implied volatility works forward. It studies present options prices and indicates the market’s expectation of future price swings. High implied volatility means that you can expect bigger price movements.
- Derived from options market prices
- Reflects future expected volatility
- Key for options traders and strategies
- Often moves inversely to market price
The Volatility Index (VIX)
The VIX, also known as the “fear gauge,” measures the expected 30-day volatility for the S&P 500 index. It’s most preferred for index volatility measurement and often referenced by traders to assess market sentiment.
- Measures expected future volatility for S&P 500
- Used widely by traders and analysts
- Indicates market fear or complacency
- Influences trading strategies and risk management

Forex Volatility Measurement
In forex, volatility is tracked using tools like Average True Range (ATR) and currency-specific volatility calculators. Forex volatility guides highlight which currency pairs have the most price movement, helping traders pick opportunities or avoid excessive risk.
- Uses ATR and specialized forex calculators
- Tracks price movement of currency pairs
- Helps identify volatile and stable pairs
- Essential for timing trades and managing risk
Understanding these volatility measurement methods gives you a well-rounded picture to better leverage your volatility calculator trading tools.
Using Volatility Calculators for Different Markets
Volatility calculators are incredibly versatile tools. Whether you trade stock indices or currencies, these calculators help measure how much prices are swinging, allowing you to act smarter and with less risk.
For Stock Indices
When it comes to indices like the S&P 500, traders rely heavily on volatility calculators linked to the VIX index. This index volatility measurement shows expected price swings for stocks in the market and signals times of fear or confidence.
- Tracks expected future price swings for major stock indices
- Helps portfolio managers adjust risk exposure
- Influences options pricing and hedging strategies
For Forex Markets
In the Forex market traders have special volatility calculators for currency pairs due its long 24-hours working, which makes real-time volatility measurements crucial. Tools like Average True Range (ATR) and forex-specific volatility guides help you identify which currency pair is most volatile, giving the biggest trading opportunities.
- Measures volatility for individual currency pairs in real time
- Helps spot which pairs are most and least volatile
- Assists in trade timing and position sizing
- Supports risk management in fast-moving forex markets
Pros and Cons of Volatility Calculators
Pros:
- Quick insights into market risk and price swings
- Data-driven decision-making tool for traders
- Available in many platforms and easy to use
Cons:
- Can lag if based only on historical data
- Implied volatility can be confusing for beginners
- Not a standalone trading signal—best used with other tools
Popular Volatility Indicators & Tools
Traders usually use Volatility calculators along with indicators and indexes to get a clear view of market conditions. Choosing the right tools can make your volatility calculator trading strategy much stronger and better.
Key Volatility Indicators
- Bollinger Bands
Bollinger Bands move with the market—widening when prices are more active and tightening when things calm down. When the bands are close together, it usually means low volatility. When they spread apart, the market is experiencing higher volatility. - Average True Range (ATR)
ATR measures the average range a market moves in a day, week, or other timeframe. It’s widely used in forex for tracking volatility and timing entries or exits. - Volatility Indexes
The most well-known example is the VIX, which tracks the expected 30-day volatility of the S&P 500. India has its own version called the India VIX, and the Volatility 75 Index is another popular measure that reflects broader market risk.
Volatility Calculator Tools
- Online volatility calculator trading apps and websites allow quick input and insights.
- Trading platforms like MetaTrader integrate volatility calculators and ATR indicators for real-time analysis.
- Many brokers provide tools that combine both historical and implied volatility for more accurate trading decisions.
Interpreting Volatility Calculator Outputs
The process of using a volatility calculator is quite simple, just add the numbers being asked and it will give the results of how much prices have been moving or are expected to move. But the tough part here is understanding what those numbers mean for smart trading decisions.
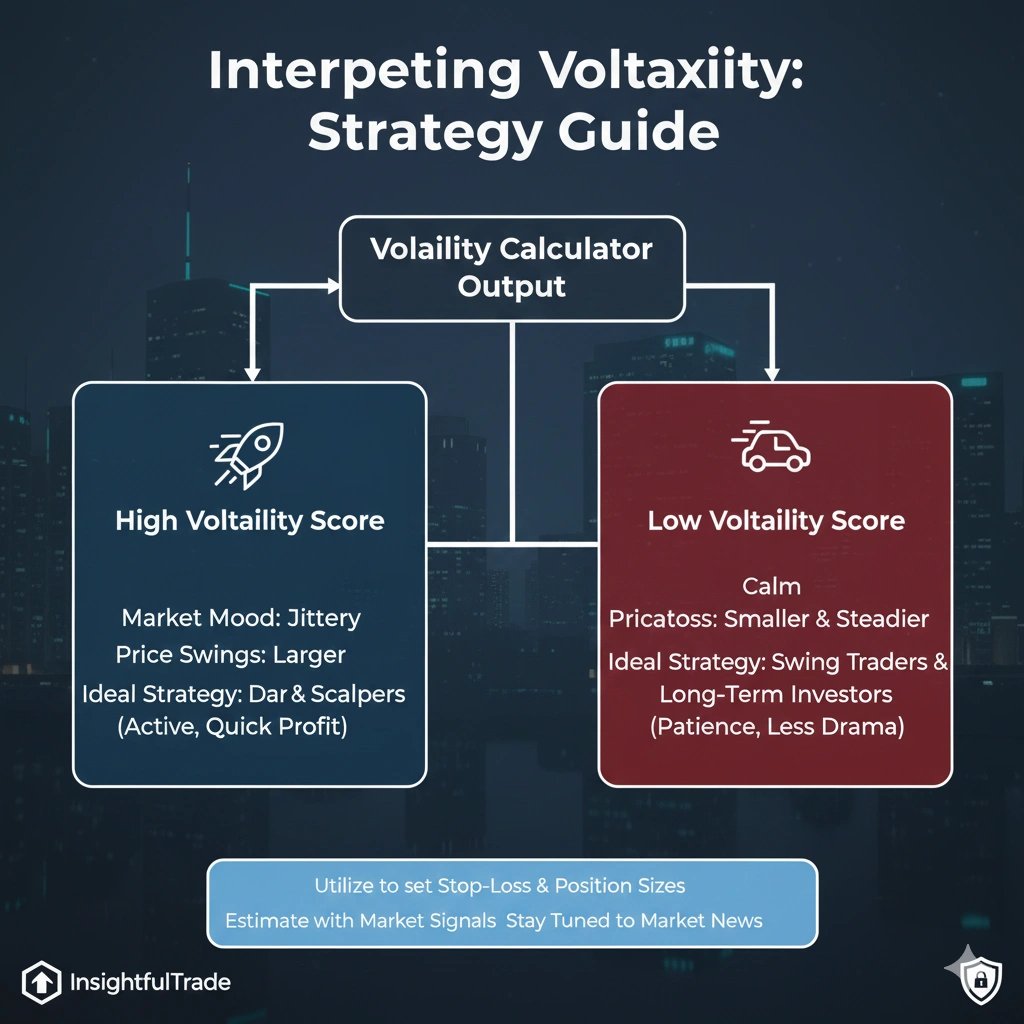
There are two major impacts in the volatile market, First high volatility which means the market is jittery. In it you can expect big price movements, more opportunities for quick profits—but also increased risk. Second Low volatility which means the market is calm. Price changes are smaller and steadier, so expect less drama but less dramatic moves.
Key Points to Remember:
- High volatility:
- Larger price swings
- Higher risk and reward potential
- Ideal for day traders and scalpers
- Low volatility:
- Smaller price movements
- Less risk, fewer big gains
- Better for swing traders and long-term investors
- Utilize the volatility calculator to set your stop-loss and position sizes.
- You can estimate volatility with market signals and analysis.
- Stay tuned to market-related news, because changes in volatility can happen rapidly.
Accurately Interpreting these facts correctly will help you stay in sync with the market’s mood—making more informed trades and better risk management.
Benefits of Using a Volatility Calculator Trading Tool
- Enhanced risk management through data-driven position sizing and stop-loss setting.
- There are high chances of identifying high-opportunity trading periods and avoiding risk during quiet or unpredictable markets.
- It boosts your confidence in trade decisions with a strong grasp over typical price behaviors.
- It helps you in forming strategies as per the market conditions for both day trading and long-term investments.
FAQs on Volatility Calculator Trading
Q1: What is a volatility calculator?
It measures the prices movement, showing market risk and helping you make trading decisions.
Q2: How does it help forex traders?
It shows volatility of currency pairs, aiding in choosing pairs and setting stops and position sizes.
Q3: What is the difference between historical and implied volatility?
The difference between them is that historical uses past price data for calculation; while implied studies the option prices to predict future market conditions.
Q4: What does high volatility mean?
High volatility means big moves, higher profits and risks, suited for active trading styles.
Q5: Can volatility calculators predict crashes?
No, it cannot be 100% accurate but it can give signals but they signal rising market risk and uncertainty to prepare traders.
Conclusion
In the end, market volatility can never be predicted with 100% certainty, but by calculating it you can get an estimate and prepare yourself accordingly. Using Volatility Calculator Trading allows you to understand price swings, manage risk, and tailor your strategy whether you trade forex, indices, or stocks. If you are looking for reliable tools and expert guidance on volatility calculator trading, then trust InsightfulTrade. Start using volatility measures today to trade better and protect your investments.
Visit InsightfulTrade for more expert trading tips and volatility tools to elevate your trading game.
Author: Kumkum Chandak
Experience: 3+ Years in Trading Research & Market Content Strategy
Kumkum Chandak is a trading content strategist and market research writer who specializes in simplifying technical analysis, trading tools, and strategy-driven educational content. Her work is optimized for EEAT, accuracy, and user intent, ensuring every article delivers practical insights for traders of all levels.
Risk Disclaimer:
All content is strictly educational and not financial advice. Trading involves substantial risk. Always perform your own analysis or consult a professional advisor.
Last Updated: 26 November 2025