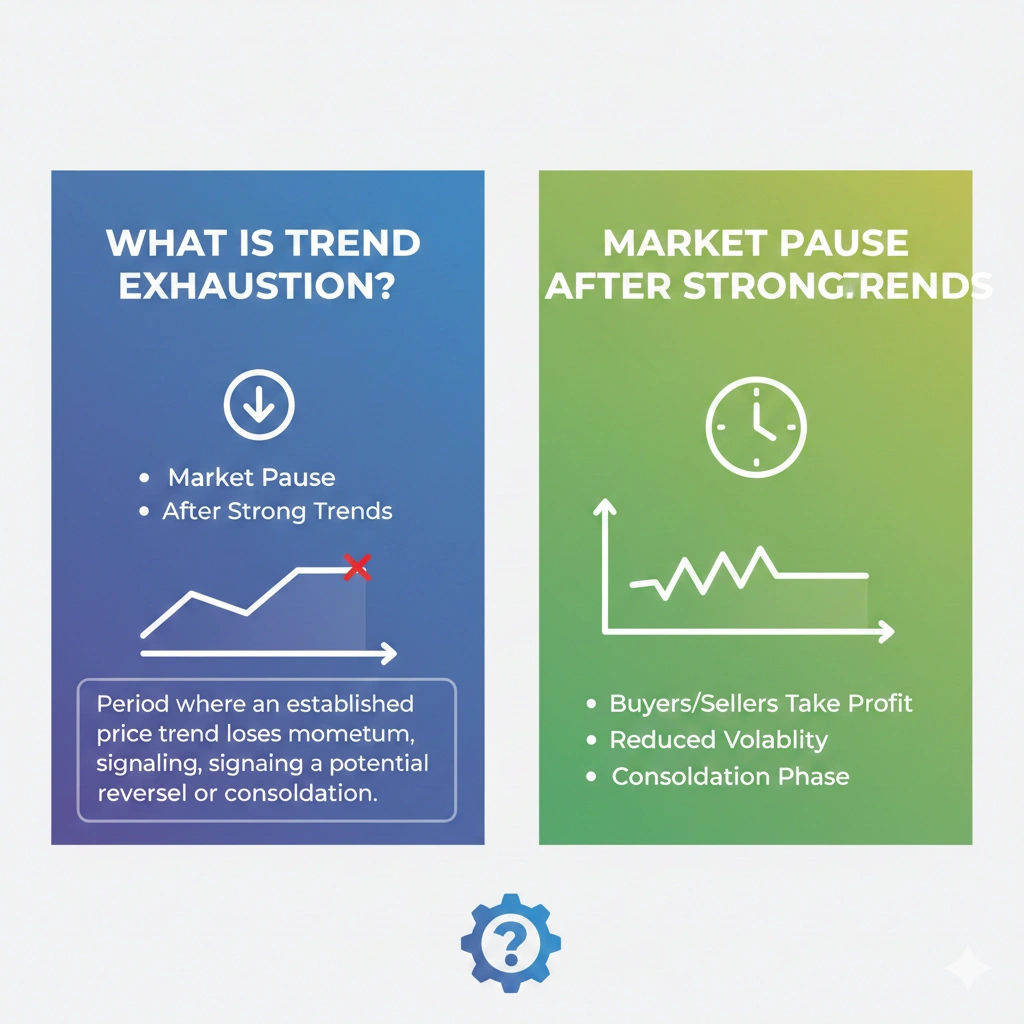
A market pause after strong trends is a temporary consolidation phase where price slows down after a strong rally or decline. It usually happens due to profit booking, cooling momentum, or lack of fresh catalysts. A pause does not automatically mean reversal confirmation is required.
Have you ever felt markets needed a time to have a rest after being up in the air for a few weeks? That is what traders refer to as a market pause after strong trends. It does not necessarily reverse; the market is sometimes just taking time to digest profits, awaiting the second strike. To identify an exhausted trend, you can observe the signs of its exhaustion to know whether the pause is a good pause or a sign of an impending change. This is an insight that makes trading less stressful and more strategic.
Quick summary
| Topic covered | Takeaway |
| Market pause after strong trends | Markets take a breather, not always a reversal |
| Trend exhaustion signals | Watch volume, RSI/MACD, and price action for hints |
| Trading strategy | Plan trades smartly during pauses using multiple indicators |
| Key insight | Spotting pauses early turns market moves into opportunities |
Understanding “Market Pause After Strong Trends”
A Market Pause After Strong Trends occurs when the price decelerates following a large move. It is simply the market catching up. Observing trend exhaustion signals, such as low volume or slowing momentum, assists the trader in identifying when it is a stall or when it may be a reversal.
What Is Trend Exhaustion?
Ever have the market going so hard and then begin to get…tired? That’s trend exhaustion. These trend exhaustion signals do not necessarily represent a reversal; they tend to be an indication of a market pause after strong trends, so the market gets time to rest.
Look for:
- Price is continually moving with smaller, weaker candles.
- Volume is decreasing despite the new highs or lows of prices.
- Momentum measures, such as RSI or MACD, are slowing down.
Real‑World Context: Recent Market Trends
S&P 500 Consolidation
The S&P 500 is decelerating towards 6,880 following a powerful surge. Small volume indicates reluctance; typical markets rest upon good trends.
For example, after a 3–4 week rally, if RSI cools from overbought levels (70+) toward 55–60 while price holds above the 20-day moving average, it often signals consolidation rather than reversal. Falling volume during this phase strengthens the pause argument.
Nifty Pause
The Nifty 50 retreated marginally at record levels. The moving averages are holding, and this indicates a healthy market rest following robust trends and then the next move.
Trend Exhaustion Signals: What to Watch
Trend exhaustion signals can show you when a market is healthy, taking a rest after good trends, and when it is a sign of a possible crash. Look for:
- Falling volume—a smaller number of traders supporting the initiative.
- Momentum divergence—loss of strength of RSI or MACD.
- Exhaustion gaps/small ranges—sudden jumps or tightening swings.
- Allusion to candlestick—indecisive dojis or long wicks.
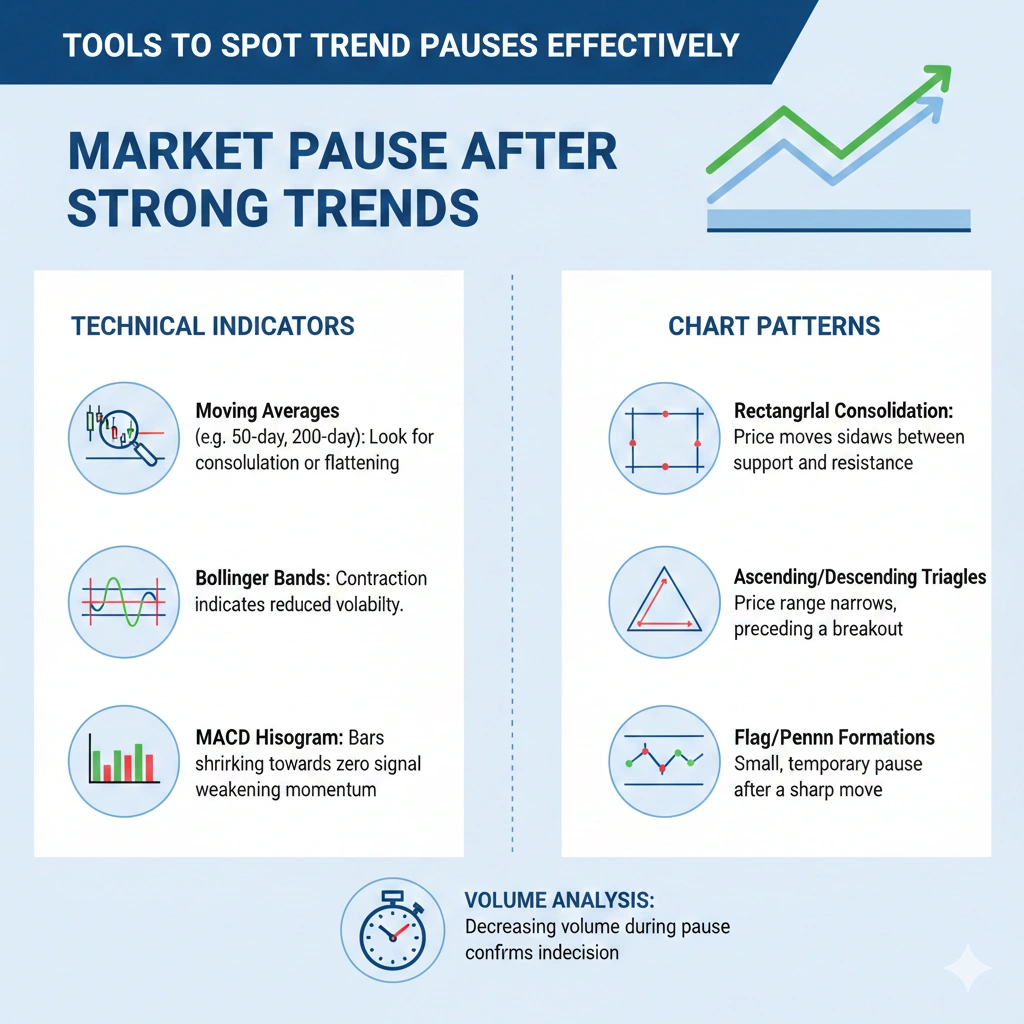
Tools to Spot Trend Pauses Effectively
To seize a market pause after strong trends:
- RSI: Oversold/overbought and trend exhaustion.
- MACD: The momentum shifts are indicated at the beginning.
- Volume Analysis: Falling volume is an indication of a pause.
- Moving averages: Records tendencies and small breaks.
Distinguishing Pause From Reversal
A market pause after strong trends is where the prices rest and the trend ascends. A turnaround changes the direction of the trend.
One easy method of distinguishing between them is to do the following:
| Pause | Reversal |
| Price flattens | Price breaks key support/resistance |
| Momentum slows | Momentum turns negative |
| Volume shrinks | Volume spikes on a breakout |
| Oscillators neutral | Oscillators confirm opposite trend |
Do not forget that a break may be merely an inhalation preceding the trend. Accurately noting trend exhaustion signs helps determine whether it is merely a pause or an actual reversal.
Practical Application for Traders & Analysts
Day Traders
In day trading, when markets reverse after good trends, the opportunity to scalp microscopic reversals, or scalp short-term moves, is provided.
Swing Traders
Swing traders monitor the patterns of trend exhaustion and chart patterns to ensure that the pause has been made before leaping into the trend.
Long-Term Investors
A market break following rising trends is also a good entry point, even for long-term investors when fundamentals remain positive.
No matter your style, it can be made smarter and less stressful by getting a healthy pause between trading and being really exhausted.
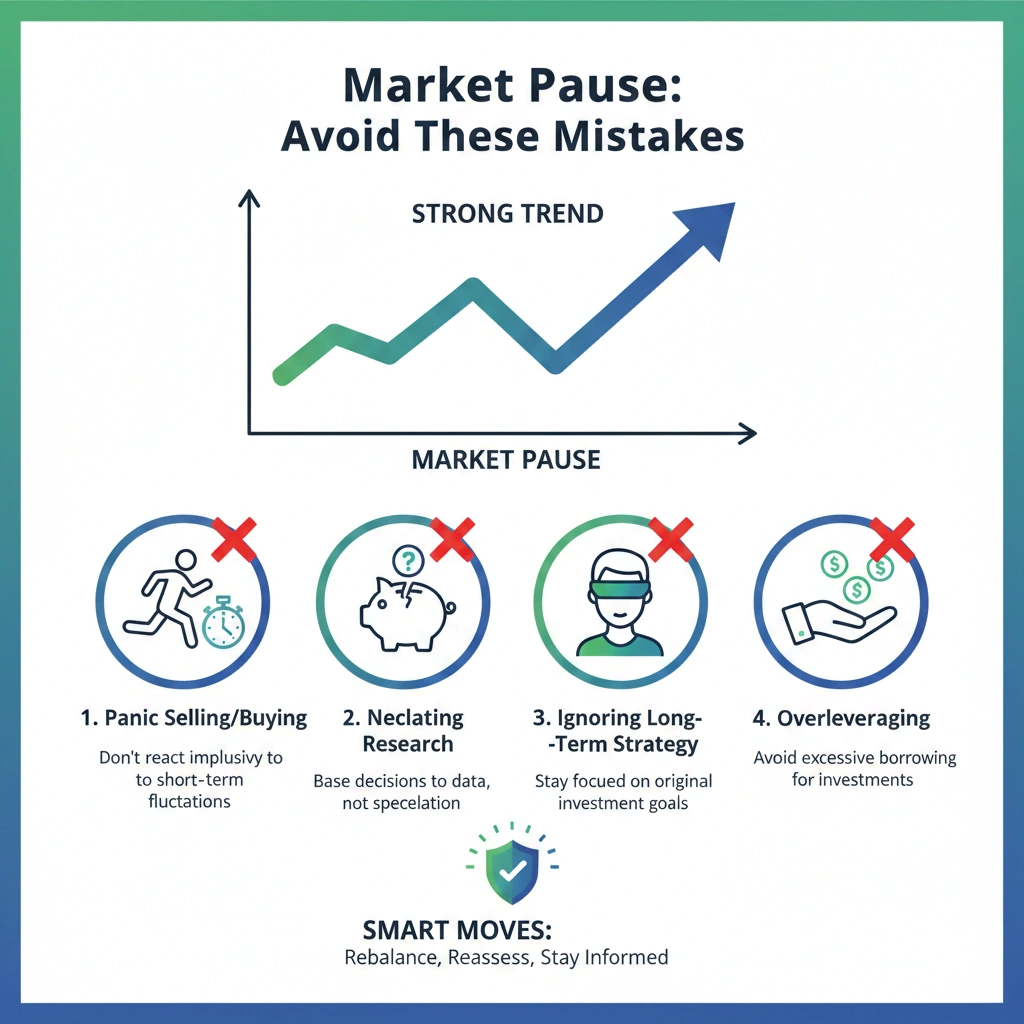
Avoiding Common Mistakes
It is not hard to observe a market pause after strong trends and assume that it will turn around, but it is not always so. Most of the pitfalls traders commit:
- Premature exit—selling too soon and failing to move up to the next.
- Countertrend trades—making a contrary bet without a confirmation.
- The reliance on a single indicator—being satisfied with RSI or MACD.
Why Markets Slow Down After Powerful Rallies
Good moves are followed by a market hiatus. Profit is booked by traders, and the momentum without breaking the trend cools.
Profit Booking
Profits become embedded following rallies, decelerating the direction of prices.
Trend Exhaustion Signals
The decreasing volume and momentum are indicative that the trend requires some rest.
Waiting for New Triggers
Markets wait until something new or a piece of information induces the next action.
How Traders Can Prepare for the Next Move During Market Pauses
Once good market trends have taken a break, it is not time to give up but time to get ready. In a slowing momentum, shrewd traders abandon reacting in favor of planning.
Carefully Read Trend Exhaustion Signals.
Monitor the trend exhaustion indicators, such as declining volume, poor momentum, or flat price movement, to determine whether the pause is healthy or dangerous.
Plan for Both Outcomes
Markets may either break out or retract after a rest. Making plans to continue and turn back makes you ready to make the next move.
Stay Patient
Inactivity during market pauses coming after good trends is sometimes the most successful action in the market to take, as it conserves money and tension.
FAQs
1. What is the best indicator for spotting a market pause after strong trends?
No single tool is the best one, but a combination of RSI divergence, volume analysis, and moving averages provides a powerful grouping of indicators.
2. How can trend exhaustion signals help with market timing?
When there is a loss of momentum, they warn you, and you can get in and out better in response to pauses or possible reversals.
3. Are market pauses always followed by reversals?
No pauses are frequent precursors of continuation following consolidation. The reversal must be further verified with such indicators as failure of support or bearish divergences.
4. Can fundamental news trigger trend exhaustion?
Yes, of course—macroeconomic information, income, or political-geographical phenomena can cause the pause stages to speed up or cause more significant shifts in the trends.
Conclusion
The knowledge of a market pause after strong trends can be the difference between the traders/investors. These are pauses (usually signaled by the signs of a trend exhaustion) and are not necessarily reversals—these are the market taking a rest. It is possible to identify healthy pauses with the help of watching volume, momentum, and price action and plan smarter trades.
Join InsightfulTrade because the identification of these trends enables you to prevent errors and use a market slowdown to your own benefit. Strong trends don’t run forever.
Author: Arihant Jain
Trading Experience: 5+ Years
Arihant Jain is a financial markets analyst and trading educator with expertise in Forex, indices, crypto, and risk-managed trading systems. His insights are based on real trading experience. data-driven analysis, and transparent market understanding. All content is reviewed for accuracy and aligns with Google’s EEAT guidelines.
Risk Disclaimer:
Trading involves substantial risk. All information is for educational purposes only and should not be taken as financial advice. Always do your own research.
Last Updated: 11 February 2026