Introduction
Trends are temporary, and that in itself is the reason to learn the symptoms of trend exhaustion signs in order to avoid some of the most costly mistakes in the trading process. You have already been a victim of a market pause after a trend, even though you were buying at the highest point or selling just before the stalling of the price. Trend exhaustion occurs when the trend is beginning to fade, big fish are now taking profits, and the price is quietly preparing to decelerate, range, or turn. The tricky part? It is easily made to appear to be a powerful extension for late traders.
Learning to recognize signs of early trend exhaustion, declining momentum, and important areas of price rejection will help you to avoid following exhausted moves and trade with patience and clarity. This guide separates the way intelligent traders see the exhaustion of the trend in the market even before the market actually changes. Let’s learn more!
What Are Trend Exhaustion Signs in Trading?
Do you know what exactly trend exhaustion signs are? One of the indications of trend exhaustion signs is that a powerful trend begins to weaken and the price cannot go on. This stage typically appears following a long-term relocation and tends to result in a market pause following a trend of expensive stagnation or conviction. This is easily confused with a breakout by many traders, but it is a signal that one should stop chasing the price and wait to be confirmed.
In simple trading terms:
- A powerful trend = a smooth momentum.
- Trend exhaustion = loss of strength.
- A trend pause in the market = contracting or stagnation.
Why Does a Market Pause After a Trend?
Primary causes of a market pause following the trend:
- Early traders take profits.
Early entrants gain by booking profit, and this decreases the pressure to buy or sell.
- Exposure is minimized in institutions.
The intelligent money scales out rather than forcing the price even further.
- The liquidity dries up in the short term.
Fewer participants would be inclined to pursue prizes at extreme levels.
- New buyers/sellers reserve.
Late traders await confirmation, leading to stalling of price.
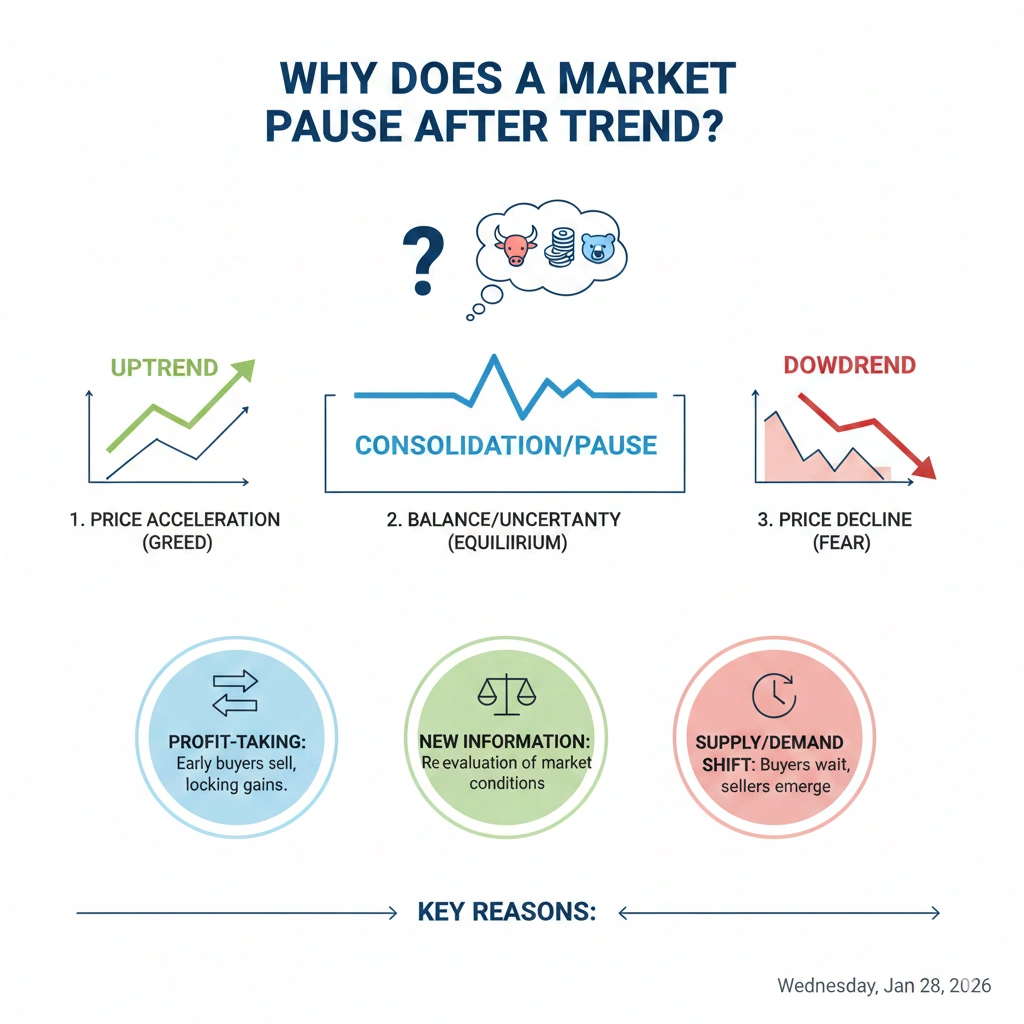
This break typically manifests itself in the form of:
- Ranges
- Flags
- Wedges
- Choppy price action
How Can You Identify Trend Exhaustion Using Price Action?
Volume validates the trend exhaustion signs indicators as it indicates when the participation is exhausted and momentum dwindles. This usually leads you to a trend followed by a pause rather than a trend followed by a continuation in the market.
Traders and indicators associated with common volume trend exhaustion:
- Price has a downward-sloping volume.
Vendors are wearing out their welcome.
- Acute increase of volume with no follow-through.
It is usually the last impetus to halt price.
- Flat price with high volume
Distribution of signals and possible consolidation.
What Role Does Volume Play in Trend Exhaustion?
Volume assists in the detection of trend exhaustion signs since waning participation is usually a forerunner of price languor. The result of this is a post-trend market pause.
Volume signals to watch:
| Scenario | Meaning |
| Rising price + falling volume | Trend weakens |
| Flat price + high volume | Distribution/pause |
| Sudden volume spike at the top | Final push/exhaustion |
US30 Example:
US30 rises, and volume peaks at the peak, yet price does not go on a sign of exhaustion and probable market pause after the trend.
Can RSI and Indicators Reveal Trend Exhaustion Signs?
The trend exhaustion signs can be indicated by pointing out when a trend is losing its steam, which is likely to cause a market pause following a trend.
Key clues:
- RSI greater than/less than 30 with divergence: momentum declining.
- Reduction in MACD histograms, loss of tendency.
- Stochastic overbought/oversold: yes, no may halt the trend.
Tip: Do not just trade on the overbought/oversold; wait until the price confirms to identify exhaustion of the trend.
What Is RSI Divergence, and Why Does It Matter?
RSI divergence occurs when it happens that the price is higher, yet the RSI is lower. This is an indication that the trend is exhausted, and a probable market pause follows the trend.
Key points:
- Weakness of signals occurs prematurely.
- Helps eschew strained movements.
- Consolidation or pullback is often caused.
NAS100 Example:
Price reaches a new high, RSI diverges, and the market stops 2 days later and pulls back approximately 3%.
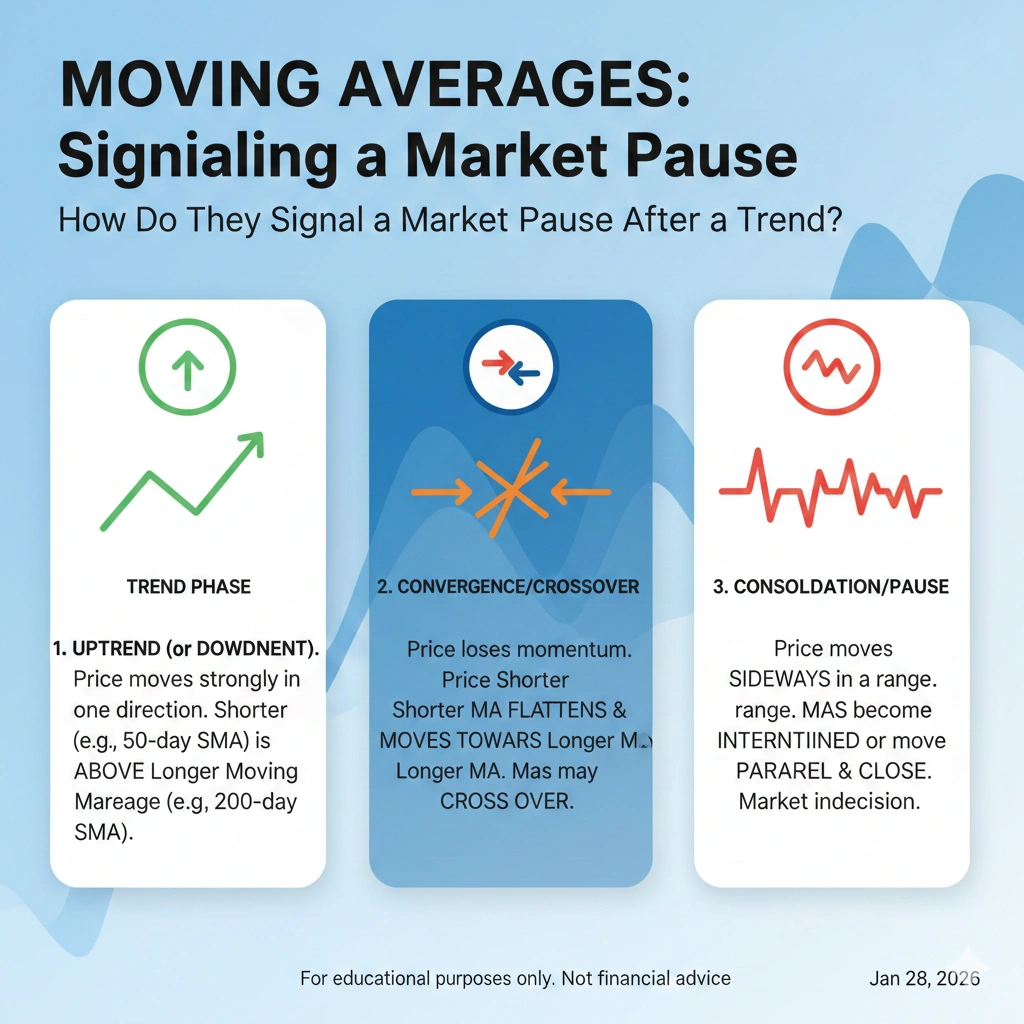
How Do Moving Averages Signal a Market Pause After a Trend?
Moving averages have trend exhaustion signs, as they presents when the price is losing strength and might stop.
| Sign | Meaning |
| Price far from 20 EMA | Overextended, the trend may struggle |
| EMA flattening | Trend slowing down |
| Price chopping around the EMA | Market pause or range forming |
EURUSD shoots above 20 EMA on H1 before sliding sideways as EMA plateaus. 20 EMA = a definite trend exhaustion signal before consolidation.
Can Candlestick Patterns Confirm Trend Exhaustion?
Candlestick patterns may indicate signs of exhausting their trends and may indicate that the market is pausing a trend.
Key exhaustion candles:
- Shooting star → top rejection
- Hanging man → trend may stall
- Doji → indecision
- Evening/Morning star→ potential turnaround.
Example:
GBPUSD soars 150 pips and establishes a shooting star; there is an RSI divergence indication, which is an undeniable indication of fatigue in the trend before it stops.
How Do Support and Resistance Levels Expose Exhaustion?
The trend exhaustion signs can be seen in the support and resistance as price stalls and usually result in a market pause after the trend.
Key levels:
- Past highs/lows – trend might level off.
- Weekly assistance/opposition – intense response.
- Whole numbers – psychological obstacles.
Gold Example:
Gold rallies to a weekly high and engulfs bearishly, a definite trend exhaustion pattern, with a 300-pip pullback.
What Is a Trend Exhaustion Formula Traders Can Use?
A basic formula is used to identify the indications of trend exhaustion and, before a market pause, a downward trend.
Trend Exhaustion Formula:
Trend Exhaustion = Long Movement + Critical Level + Weak Momentum + Price Rejection.
Key points:
- Long Move is a long trend running.
- Level 2/Levels of key resistance/support strong.
- Momentum Weakness → deceleration of indicators/volume.
- Rejection of the price candles exhibits loss of control.
Increasing the number of conditions increases the trend exhaustion signal.
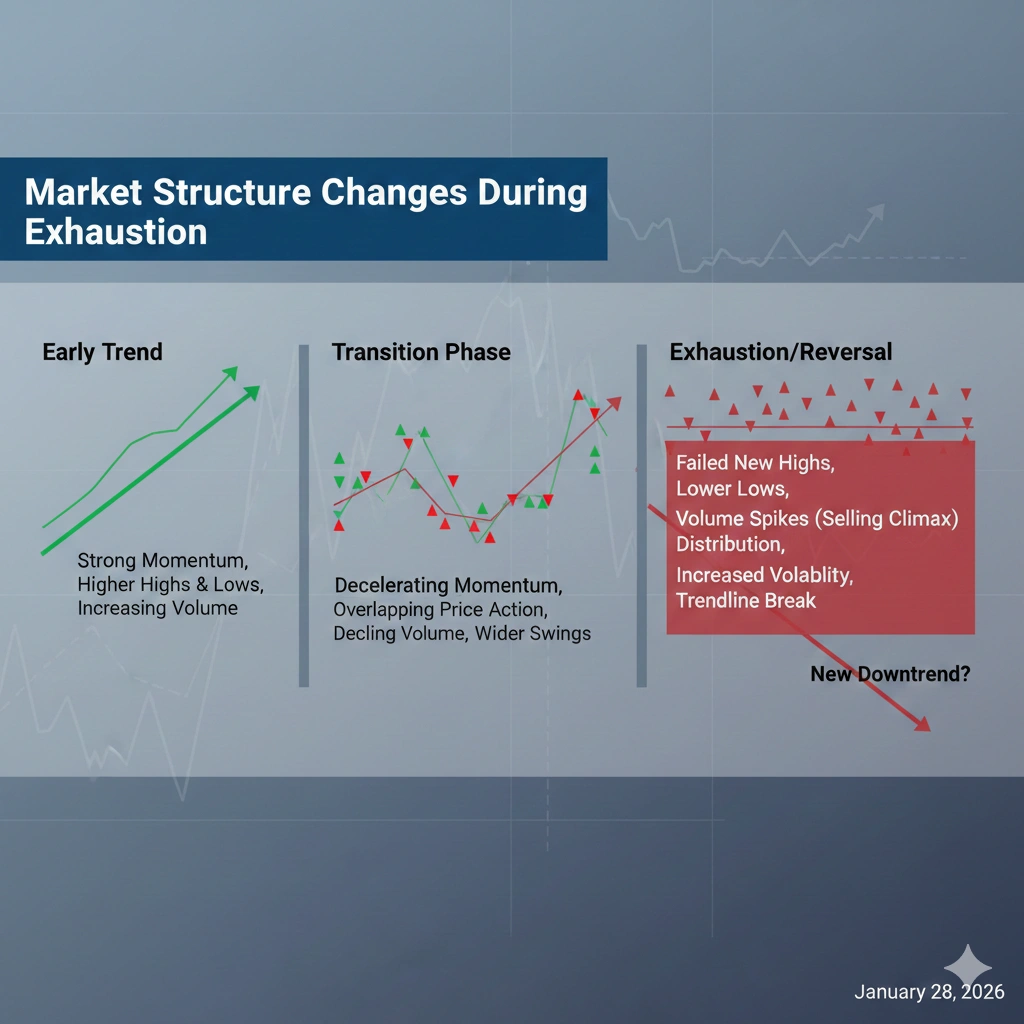
How Does Market Structure Change During Exhaustion?
The market structure begins to change as the trend loses momentum, and a pause in the market after the trend is probable in trend exhaustion.
Key structure changes:
Climbs on higher ground → level highs to buyers decelerating.
Decreasing lows → level lows → depleted strength of sellers.
Break of minor structure → trend commencing a transition.
FAQs
Q.1 What is the most reliable trend exhaustion sign?
There is no particular indicator; confluence is important (price action + divergence + level).
Q.2 Does trend exhaustion always mean reversal?
No. It usually results first in a market pause following a trend or a consolidation.
Q.3 Which timeframe is best for spotting exhaustion?
The most credible ones are H1, H4, and Daily.
Q.4 Can trend exhaustion be traded profitably?
Yes, when risk control and confirmation are added to it.
Q.5 Are trend exhaustion signs useful for scalpers?
Yes, but just at important intraday levels, having volume verification.
Conclusion
The ability to detect signs of trend exhaustion signs is a game changer on the part of traders. A stall in a trend usually results in a market hiatus following the trend, which allows shrewd traders an opportunity to hedge gains and foil a last-minute rush. Putting price action, volume, indicators, and candlestick patterns with key levels, you can identify when the trend is becoming weary and be patient. It is important to remember that trend exhaustion is not necessarily a reversal; it can be preceded at first by consolidation. Learning these signs will enable you to trade smarter, minimize errors, and be a step ahead in any market.
Master trend exhaustion signs with InsightfulTrade! Spot market pauses, avoid chasing exhausted trends, protect profits, and trade smarter. Start learning real strategies and actionable tips today!
Author: Arihant Jain
Trading Experience: 5+ Years
Arihant Jain is a financial markets analyst and trading educator with expertise in Forex, indices, crypto, and risk-managed trading systems. His insights are based on real trading experience, data-driven analysis, and transparent market understanding. All content is reviewed for accuracy and aligns with Google’s EEAT guidelines.
Risk Disclaimer:
Trading involves substantial risk. All information is for educational purposes only and should not be taken as financial advice. Always do your own research.
Last Updated: 29 January 2026