Introduction
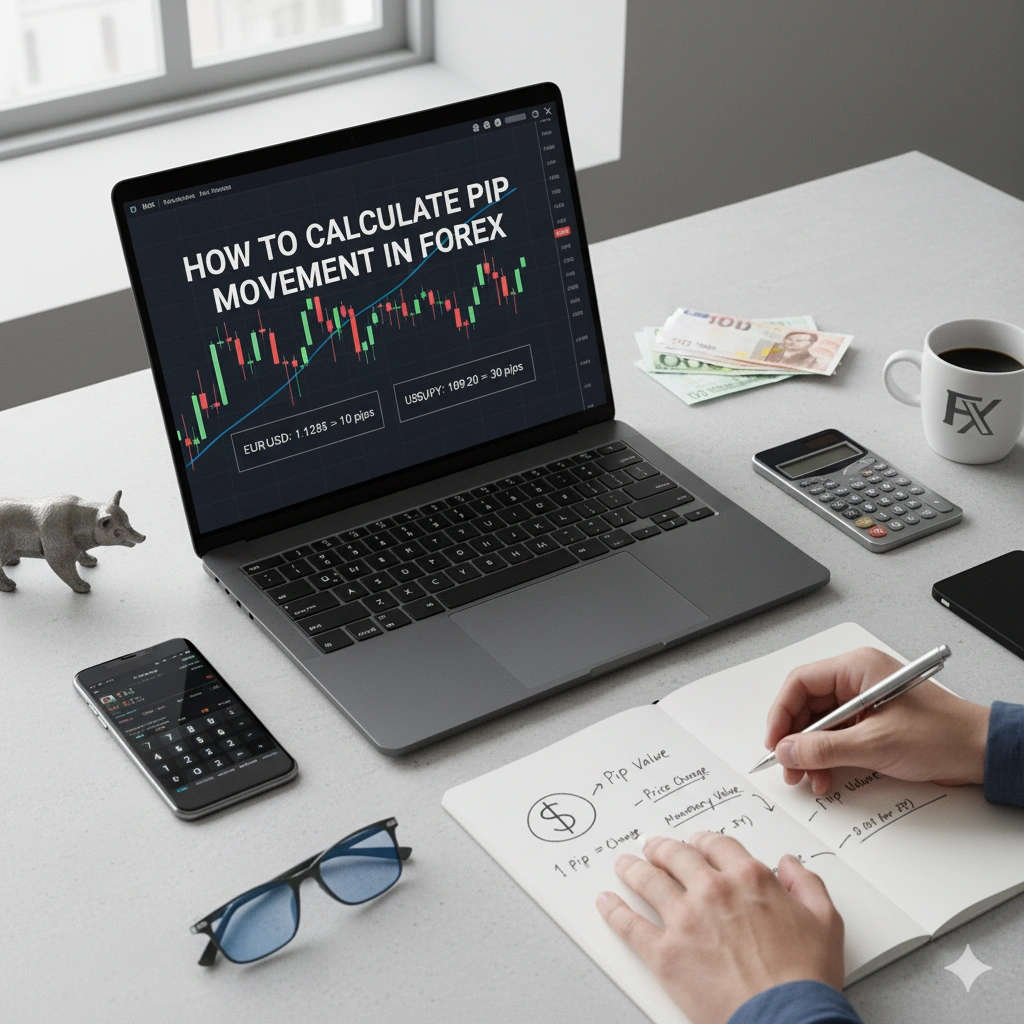
A pip is the unit of change in price, which a currency pair can experience in the forex trading process, and it is one of the basic elements in the evaluation of change in exchange rates. A pip is usually the fourth decimal place (0.0001), which is the case with most pairs of currencies, and the second decimal place (0.01) with Japanese yen pairs. This guide on how to calculate pip movement will take you through the key formula of pip movement, how to determine the value of a pip per currency pair, and what the peculiarities of calculating the size of a pip in the forex market are.
Knowing how to calculate pip movement, traders will be able to know the exact position sizes, establish good stop and take profit levels, and ensure the sound utilization of their trading capital.
What is a Pip in Forex Trading?
Pip, which is an abbreviated form of “percentage in point,” is the smallest price change unit of the forex trade. Pips are basic elements for every trader because they assist in gauging the price drops and determining the profit or losses made. The forex pip size calculation is based on this concept and should be used in risk and money management.
Why Is Pip Movement Important for Forex Traders?
The movement of pips is imperative since it measures the extent to which a currency price fluctuates. So it’s important to learn how to calculate pip movement.
- Determine market volatility and price trends.
- Determine possible profits and losses.
- Control the trading risk by establishing a stop-loss and take-profit point.
- Learning to move the pips will result in successful trade planning and improvement with time.
What is the standard pip size in Forex?
For most pairs: 1 pip = 0.0001
For JPY pairs: 1 pip = 0.01
This distinction is a foundation in the pip movement formula and influences the way you are going to compute the value of pips per currency pair. As an example, one pip shift in EUR/USD is the movement of 0.0001, and in USD/JPY it is the movement of 0.01.
How to Calculate Pip Movement: The Basic Formula Explained
Pip movement formula:
Pip movement = price difference
Pip size
Step by step:
- Determine entry and exit prices.
- Divide these prices and determine their difference.
- Divide the pip size of the currency pair.
Example:
EUR/USD moves from 1.2000 to 1.2050. The difference is 0.0050.
How to Calculate Pip Movement Value for Different Currency Pairs
Let’s discuss more about how to calculate pip movement. Each currency pair has a distinct pip value in each currency pair based upon
Lot size (typical lot size = 100,000 units)
Exchange rate:
Pip value formula:
Pip value = One pip x Lot size
Exchange rate
Example: At the price of EUR/USD 12000, of a standard
0.0001 X 100,000 ÷ 1.2000 = 8.33 USD per pip
That is, the profit or loss of each one of the pips is $8.33.

How Does Pip Value Vary with Lot Size?
- Standard lot (100,000 units) Higher value of pip, e.g., about 10 per pip in EUR/USD.
- Mini lot (100,000): One-tenth and about 1 per pip.
- Micro lot (1,000 units) One hundredth, approximately $0.10 per pip.
This is important in the calculation of the size of forex pipes and risk management for different account sizes and trading plans.
How to Use the Calculate Pip Movement Formula in Real Trading?
Record your trade open and close prices.
- Calculate the difference between the prices (closing price – opening price).
- Take the difference divided by the size of pip movements.
- Profit/loss: multiply the pip value per currency pair by the number of pips.
- Decrease or increase the size of your position in line with your risk management plan.
How does the pip differ for currency pairs involving the Japanese yen?
In currency pairs that contain the Japanese yen, the pip is 0.01 and not 0.0001, as is the case with most other pairs. The price change divided by 0.01 is used to compute the movement of the pips. To illustrate, when USD/JPY goes up from 150.00 to 150.50, it has a 50 pip movement since (0.50/0.01) = 50 pips.
What’s an example of calculating pip movement in forex?
Take the case that you have brought a GBP/USD trade at 1.3200 and sold at 1.3230. The difference is 0.0030. The movement of 30 pips can be achieved by dividing by the pip size (0.0001). Doing a standard lot, a single pip will be equivalent to ten dollars, and thus the overall movement of pips will result in a 300-dollar gain. This illustration shows the importance of being careful when doing calculations of pip movement in the case of real trading, particularly when it comes to assessing the profit or loss.
Practical pip movement examples for popular currency pairs
| Currency pair | Entry price | Exit price | Pip size | Pip movement | Pip value (1 lot) |
| EUR/USD | 1.1000 | 1.1050 | 0.0001 | 50 | $10 |
| USD/JPY | 110.00 | 110.50 | 0.01 | 50 | Approx. $9.09 |
| GBP/USD | 1.2500 | 1.2550 | 0.0001 | 50 | $10 |
Common Mistakes to Avoid When Calculating Pip Movement
- Mixing up pip size JPY or non-JPY pairs.
- Failing to deal with the lot size adjustment of the pip value.
- Disregard of pipettes in accurate price quotes.
- Ignoring the conversion of currency when your account currency is different from the quote currency.
- Failures to calculate the difference between pip based on spread or commission costs.

FAQs
1. What is a pip in forex?
The smallest price movement in a currency pair is called a pip, typically four decimal places (0.0001), although JPY pairs move in two decimal places (0.01).
2. How do you calculate pip value?
Pip value is calculated by dividing the exchange rate by a single pip and multiplying by the lot size.
3. Why does pip value differ across currency pairs?
Pip values are homogeneous due to the exchange rates’ variance and the sizes of pips of various commodities, such as JPY pairs, which have different pip sizes.
4. What is the pip difference in forex?
It describes the mathematical change in price between two price levels in pips, which is vital in the computation of gain or loss.
5. What lot sizes affect pip calculation?
The lot sizes of 100,000 (standard lot size) and 10,000 (mini lot size) have a direct impact on the pip value in trading.
Conclusion
Thinking of how to calculate pip movement in forex? One of the basics of trading and risk management is to calculate pip movement in forex, and every trader must learn this skill before becoming a successful trader. With precise determination of pip movement, the estimators can measure the change in price between two points, which will be vital in the estimation of gains or losses.
It is done by calculating the difference between the entry price and the exit price and dividing them by the pip size in the currency pair. The calculation not only indicates the calculated pip movement but also preconditions the process of calculating the pip value, which is the monetary value of each pip depending on the size and the exchange rate.
Adding calculator pip movement and pip value calculating to your trading strategy will increase accuracy and control, and you can make better choices and risk-reward analyses. Utilize the expert tip for how to calculate pip movement from Insightful Trade in detail to ensure a safe and secure trade in this dynamic forex market.
Author: Arihant Jain
Trading Experience: 5+ Years
Arihant Jain is a financial markets analyst and trading educator with expertise in Forex, Indices, Crypto, and risk-managed trading systems. His insights are based on real trading experience, data-driven analysis, and transparent market understanding. All content is reviewed for accuracy and aligns with Google’s EEAT guidelines.
Risk Disclaimer:
Trading involves substantial risk. All information is for educational purposes only and should not be taken as financial advice. Always do your own research.
Last Updated: 1 November 2025