Introduction to RSI Trading in Forex
The forex market offers countless opportunities for traders, but identifying the right entry and exit points can often be challenging, especially for beginners. Among the various tools available, the Relative Strength Index, commonly known as RSI, is one of the most popular and effective indicators used by traders worldwide. A well-planned RSI trading strategy can help traders identify potential market reversals, confirm trends, and improve overall trading performance.
Developed by J. Welles Wilder, the RSI indicator measures the speed and magnitude of price movements. It is primarily used to determine whether a market is overbought or oversold. Because of its simplicity and effectiveness, the RSI trading strategy has become a fundamental part of many trading systems.
Whether you are new to forex trading or looking to strengthen your existing approach, understanding how the RSI indicator forex tool works can significantly improve your market decisions. When combined with proper risk management and solid technical analysis, RSI can become a powerful component of a complete trading plan.
Understanding the RSI Indicator in Forex Trading
Before implementing an RSI trading strategy, it is important to understand how the indicator functions.
The RSI indicator forex traders use is a momentum oscillator that fluctuates between 0 and 100. It measures the strength of recent price movements and helps traders evaluate whether a currency pair is potentially overbought or oversold.
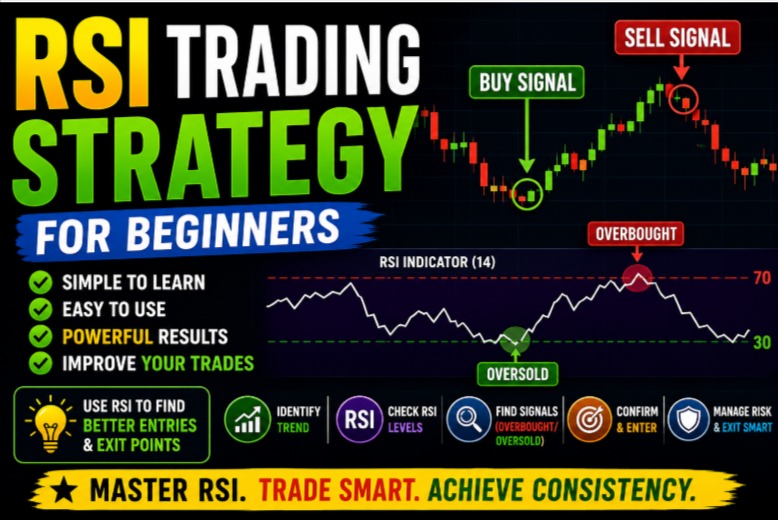
Traditionally, RSI readings above 70 indicate that a market may be overbought, while readings below 30 suggest oversold conditions. These levels provide valuable insight into market sentiment and possible reversal opportunities.
The indicator is widely used in momentum trading because it helps traders gauge the strength of prevailing price movements. Strong momentum often pushes RSI toward extreme levels, signaling potential continuation or reversal scenarios.
Many traders rely on the RSI indicator forex tool as part of their daily technical analysis because it provides objective information about market conditions.
Why Beginners Should Use an RSI Trading Strategy
One of the primary reasons beginners prefer an RSI trading strategy is its simplicity. Unlike complex systems involving multiple indicators and sophisticated calculations, RSI provides clear visual signals that are easy to interpret.
The indicator helps new traders avoid emotional decision-making by offering objective criteria for entering and exiting trades. Since emotions frequently lead to poor trading decisions, having a structured RSI trading strategy can significantly improve consistency.
Another advantage is that RSI works effectively across various market conditions. Whether traders engage in swing trading, day trading, or momentum trading, the indicator can provide valuable insights into price behavior.
Additionally, combining the RSI indicator forex traders commonly use with other forms of technical analysis can increase the reliability of trading signals and reduce false entries.
Understanding Overbought and Oversold Conditions
The concepts of overbought oversold conditions are central to every successful RSI trading strategy.
An overbought market occurs when price has risen rapidly over a short period. In such situations, the RSI typically moves above the 70 level, suggesting that buying pressure may be losing momentum and a price correction could occur.
Conversely, an oversold market develops when prices decline significantly within a short timeframe. RSI readings below 30 often indicate oversold conditions, suggesting that selling pressure may be weakening and buyers could soon return.
However, traders should understand that overbought oversold signals do not automatically mean price will reverse immediately. Markets can remain in overbought oversold territory for extended periods, particularly during strong trends.
For this reason, experienced traders combine overbought oversold signals with additional technical analysis tools before making trading decisions.
Basic RSI Trading Strategy for Beginners
A simple RSI trading strategy begins by identifying potential reversal opportunities using standard RSI levels.
When the RSI indicator forex traders use falls below 30, traders monitor the market for potential buying opportunities. Once RSI moves back above the 30 level, it may indicate that bearish momentum is weakening.
Similarly, when RSI rises above 70 and subsequently falls back below this threshold, traders may consider potential selling opportunities.
This approach is especially useful in range-bound markets where prices frequently oscillate between support and resistance zones.
Many beginners use this method as their introduction to momentum trading because it teaches them how momentum shifts influence price movements.
Nevertheless, relying solely on overbought oversold conditions may generate false signals. Therefore, additional confirmation through price action or broader technical analysis is recommended.
Using RSI in Momentum Trading
The Relative Strength Index plays an important role in momentum trading because it measures the strength behind price movements.
Strong upward momentum generally causes RSI to remain above 50 and occasionally reach overbought territory. Likewise, sustained bearish momentum often keeps RSI below 50 and sometimes pushes it into oversold conditions.
In momentum trading, traders frequently use the 50 level as a trend filter. If RSI remains above 50, bullish momentum is considered dominant. When RSI stays below 50, bearish momentum may be prevailing.
Combining a RSI trading strategy with momentum trading principles allows traders to align their trades with prevailing market strength rather than trading against strong trends.
Professional traders often monitor the RSI indicator forex markets provide to determine whether momentum supports their trade setups.
RSI Divergence and Market Reversals
One of the most powerful applications of the RSI trading strategy involves divergence analysis.
Divergence occurs when price and the RSI indicator move in opposite directions. This discrepancy can signal weakening momentum and the possibility of a market reversal.
Bullish divergence occurs when price forms lower lows while the RSI indicator forex traders monitor forms higher lows. This pattern suggests that bearish momentum is weakening.
Bearish divergence develops when price creates higher highs while RSI forms lower highs. Such conditions may indicate declining bullish momentum.
Divergence analysis is widely respected in technical analysis because it often provides early warning signs of trend reversals.
Although divergence can improve an RSI trading strategy, traders should still seek confirmation before entering positions.
Combining RSI with Technical Analysis
No indicator should be used in isolation. Successful traders frequently combine RSI with other forms of technical analysis to strengthen trading decisions.
Support and resistance levels are particularly useful companions for RSI. For example, if price reaches a strong support level while RSI simultaneously enters overbought oversold territory on the oversold side, the probability of a bullish reversal may increase.
Candlestick patterns such as bullish engulfing formations or pin bars can further confirm RSI signals.
Moving averages also complement the RSI trading strategy by helping traders identify the prevailing trend direction.
Integrating multiple forms of technical analysis enables traders to filter poor-quality setups and focus on high-probability opportunities.
This comprehensive approach can significantly improve the effectiveness of both momentum trading and reversal-based strategies.
Common Mistakes Beginners Make with RSI
Many new traders misuse the RSI trading strategy by assuming that every overbought or oversold reading guarantees an immediate reversal.
In reality, markets can remain in overbought oversold conditions for extended periods, especially during strong trends. Entering trades prematurely can result in unnecessary losses.
Another common mistake is ignoring broader market context. Traders should always consider trend direction, support and resistance levels, and overall market sentiment alongside the RSI indicator forex signals.
Overtrading is also a frequent problem. Because RSI generates numerous signals, beginners may feel tempted to trade excessively. Maintaining discipline and following a structured momentum trading plan is essential.
Finally, neglecting risk management can undermine even the most effective technical analysis methods.
Risk Management in an RSI Trading Strategy

Risk management remains a critical component of every successful RSI trading strategy.
Regardless of how strong a signal appears, traders should always define their risk before entering a trade. Stop-loss orders should be placed at logical levels based on price structure rather than arbitrary distances.
Position sizing is equally important. Many experienced traders risk only a small percentage of their account balance on any single trade.
The RSI indicator forex traders rely on can provide excellent trading opportunities, but no indicator is perfect. Losing trades are inevitable, making disciplined risk management essential for long-term success.
Combining sound money management with careful technical analysis creates a sustainable approach to forex trading.
Building a Complete RSI Forex Trading Plan
A complete trading plan begins with identifying the overall market trend. Traders can then use a RSI trading strategy to locate favorable entry opportunities aligned with that trend.
For example, during an uptrend, traders may focus primarily on oversold RSI signals while avoiding countertrend trades. In a downtrend, overbought signals may receive greater attention.
Using the RSI indicator forex markets provide alongside support and resistance levels, candlestick analysis, and broader technical analysis can substantially improve decision-making.
Incorporating momentum trading concepts also helps traders understand whether market strength supports potential trade setups.
Consistency, patience, and discipline remain essential elements of any successful trading plan.
Conclusion
The RSI trading strategy is one of the most effective and beginner-friendly methods available in forex trading. By understanding how the RSI indicator forex markets use measures momentum, traders can identify potential reversals, confirm trends, and improve trade timing.
Learning to interpret overbought oversold conditions correctly is essential for maximizing the indicator’s effectiveness. When combined with momentum trading principles and broader technical analysis, RSI becomes a powerful tool capable of supporting long-term trading success.
For beginners entering the forex market, mastering the RSI trading strategy can provide a strong foundation for developing consistent and disciplined trading habits.