Understanding Bollinger Bands and Their Importance in Forex Trading
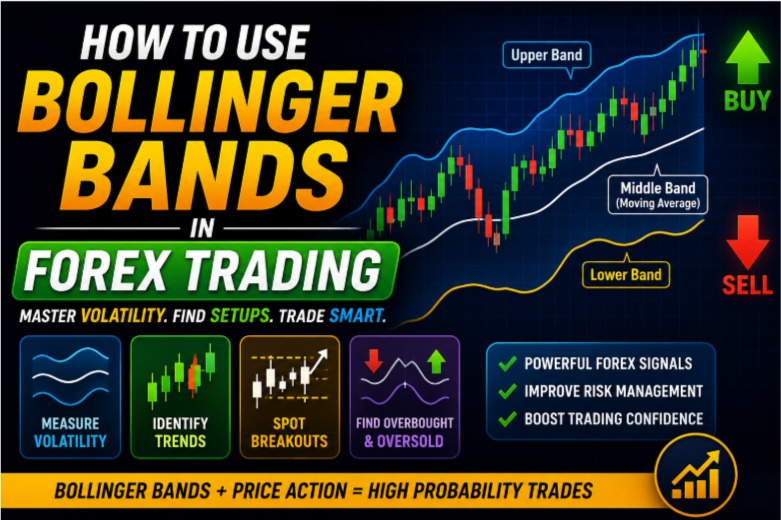
Technical analysis plays a critical role in forex trading, helping traders identify opportunities, manage risk, and make informed decisions. Among the many tools available to traders, Bollinger Bands forex remains one of the most popular and versatile indicators. Developed by John Bollinger, Bollinger Bands help traders measure market volatility, identify potential breakout opportunities, and generate valuable trading signals.
The indicator consists of three lines: a middle moving average and two outer bands that expand and contract based on market volatility. When volatility increases, the bands widen. When volatility decreases, the bands narrow. This simple yet powerful concept allows traders to better understand market conditions and anticipate potential price movements.
One reason Bollinger Bands forex is widely used is its ability to adapt to changing market environments. Unlike static indicators, Bollinger Bands adjust dynamically according to price behavior, making them useful in both trending and ranging markets.
For traders seeking to improve their market analysis, understanding how Bollinger Bands forex interacts with price action can provide valuable insight into future market direction and trading opportunities.
How Bollinger Bands Measure Market Volatility
One of the primary purposes of Bollinger Bands forex is to measure market volatility. Volatility refers to the degree of price fluctuation within a market over a given period.
During periods of low volatility, the distance between the upper and lower Bollinger Bands becomes smaller. This narrowing often indicates market consolidation and reduced trading activity. Conversely, when volatility increases, the bands expand as price movements become more aggressive.
Because of this relationship, Bollinger Bands are often categorized among the most effective volatility indicators available to forex traders. By monitoring changes in band width, traders can assess whether the market is becoming more active or entering a period of consolidation.
Professional traders frequently use volatility indicators to identify changing market conditions before significant price movements occur. Bollinger Bands provide a visual representation of volatility that can enhance trading decisions and improve overall market awareness.
The Structure of Bollinger Bands Forex
To fully understand Bollinger Bands forex, traders must first understand its components. The middle band is typically a 20-period moving average, which represents the average market price over a specified period.
The upper and lower bands are calculated using standard deviations from the moving average. These bands expand and contract based on changes in market volatility.
This structure allows Bollinger Bands forex to function as both a trend-following and volatility-based indicator. Traders can use the bands to identify overbought and oversold conditions, monitor trend strength, and detect potential breakout opportunities.
The indicator’s flexibility makes it a valuable addition to any trading system focused on technical analysis and market behavior.
Bollinger Bands as Volatility Indicators
Among all available volatility indicators, Bollinger Bands are particularly effective because they provide both visual and quantitative information about market conditions.
When the bands contract significantly, traders often anticipate a period of increased activity. This phenomenon is commonly known as the “Bollinger Band Squeeze.” During a squeeze, volatility declines and prices often move within a narrow range.
Many traders use these squeezes as part of a breakout strategy because periods of low volatility are frequently followed by significant price movements. The ability of Bollinger Bands to identify these conditions makes them one of the most useful volatility indicators in forex trading.
By combining Bollinger Bands with other forms of technical analysis, traders can improve their ability to anticipate future market behavior.
Using Bollinger Bands for Forex Signals
Generating reliable forex signals is one of the primary goals of technical analysis. Bollinger Bands can provide several types of signals that help traders identify potential trading opportunities.
For example, when price touches or moves outside the upper band, it may indicate strong bullish momentum. Similarly, when price reaches the lower band, bearish momentum may be increasing.
However, traders should avoid interpreting every band touch as an immediate reversal signal. Instead, forex signals generated by Bollinger Bands should be evaluated within the broader context of market conditions.
Many professional traders combine forex signals from Bollinger Bands with support and resistance analysis, candlestick patterns, and trend confirmation techniques to improve accuracy.
The Bollinger Band Squeeze and Breakout Strategy
One of the most popular applications of Bollinger Bands forex is identifying breakout opportunities. The Bollinger Band Squeeze occurs when the bands narrow significantly due to reduced market volatility.
Periods of low volatility often precede major market movements. As a result, many traders use the squeeze as the foundation of a breakout strategy designed to capture large price movements once volatility returns.
A typical breakout strategy involves monitoring periods of consolidation and waiting for price to break above or below the bands with strong momentum. The direction of the breakout often provides valuable information regarding future market trends.
Because Bollinger Bands are highly responsive to changes in volatility, they remain one of the most effective tools for traders focused on breakout strategy development.
Combining Bollinger Bands With Technical Analysis
Although Bollinger Bands forex is powerful on its own, its effectiveness often increases when combined with broader technical analysis techniques.
Many traders use trend lines, support and resistance levels, moving averages, and momentum indicators alongside Bollinger Bands. These additional tools help confirm potential trade setups and reduce the likelihood of false signals.
The integration of technical analysis with Bollinger Bands allows traders to develop a more comprehensive understanding of market conditions. This approach improves confidence and supports more informed decision-making.
Professional traders rarely rely on a single indicator. Instead, they combine multiple analytical methods to strengthen their trading strategies and improve performance.
Using Bollinger Bands in Trending Markets
Trending markets present unique opportunities for traders using Bollinger Bands forex. During strong trends, prices often remain near one side of the bands for extended periods.
In an uptrend, prices may consistently approach the upper band without necessarily indicating overbought conditions. Similarly, during downtrends, prices may remain close to the lower band.
Understanding this behavior is important because many beginner traders mistakenly interpret every band touch as a reversal signal. Effective technical analysis requires evaluating Bollinger Band behavior within the context of the prevailing market trend.
The combination of trend analysis and forex signals generated by Bollinger Bands can help traders identify high-probability trading opportunities.
Bollinger Bands in Range-Bound Markets
While Bollinger Bands perform well during trends, they are also effective in ranging markets. When prices move between established support and resistance levels, the bands can help identify potential reversal points.
In these conditions, traders often use forex signals generated by band touches to anticipate short-term reversals. Price approaching the upper band may indicate resistance, while movement toward the lower band may suggest support.
Because ranging markets often exhibit lower volatility, Bollinger Bands function effectively as volatility indicators, helping traders identify shifts in market behavior before significant changes occur.
Combining Bollinger Bands with traditional technical analysis techniques can improve trade timing and overall market understanding.
Common Mistakes When Using Bollinger Bands Forex
Despite their popularity, traders often misuse Bollinger Bands forex due to misunderstandings regarding their purpose.
One common mistake involves treating every upper or lower band touch as a reversal signal. In reality, strong trends can cause prices to remain near the bands for extended periods.
Another mistake involves using Bollinger Bands without considering market volatility. Because Bollinger Bands function as volatility indicators, understanding volatility conditions is essential for accurate interpretation.
Successful traders recognize that forex signals should always be evaluated within the broader market context rather than viewed as standalone trading instructions.
Developing a Breakout Strategy With Bollinger Bands
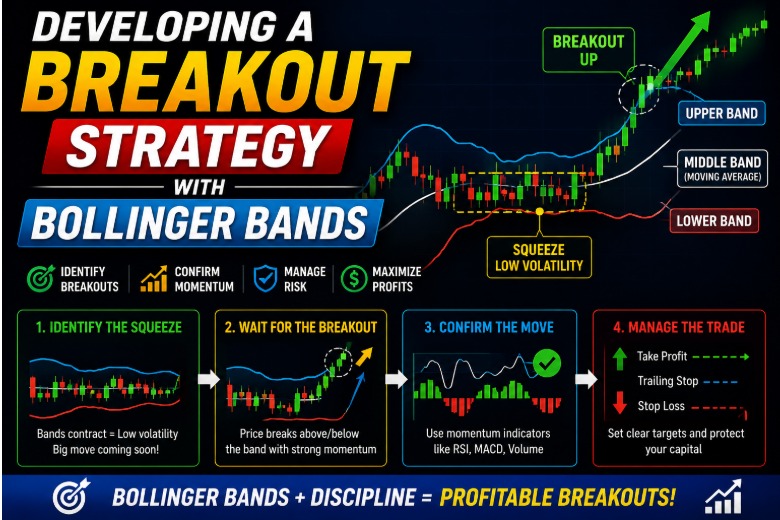
A successful breakout strategy requires patience, discipline, and confirmation. Traders should avoid entering trades solely because the bands are narrowing.
Instead, they should wait for price to break above or below key levels with strong momentum and supporting market conditions. The combination of Bollinger Bands and other technical analysis tools can help validate breakout opportunities.
Many traders use volume, momentum indicators, and price action patterns to strengthen their breakout strategy and reduce the risk of false breakouts.
The flexibility of Bollinger Bands forex makes them an ideal component of both short-term and long-term trading systems.
Risk Management and Bollinger Bands Trading
Risk management remains essential regardless of which indicator a trader uses. While Bollinger Bands forex can generate valuable forex signals, no indicator guarantees success.
Stop-loss placement, position sizing, and disciplined trade management are crucial components of a successful trading plan. Bollinger Bands can assist with risk management by helping traders identify logical support and resistance levels.
The use of volatility indicators such as Bollinger Bands can also help traders adjust position sizes according to changing market conditions.
Combining proper risk management with sound technical analysis significantly improves long-term trading performance.
Conclusion
Bollinger Bands remain one of the most versatile and effective tools available to forex traders. As a leading Bollinger Bands forex indicator, they help traders measure volatility, identify market trends, and generate valuable forex signals.
Their role as powerful volatility indicators makes them particularly useful for identifying changing market conditions and developing a reliable breakout strategy. When combined with broader technical analysis, Bollinger Bands can provide deeper market insight and improve trading decisions.
Whether trading trends, ranges, or breakout opportunities, traders who understand how to use Bollinger Bands forex effectively can gain a significant advantage in navigating the complexities of the forex market.