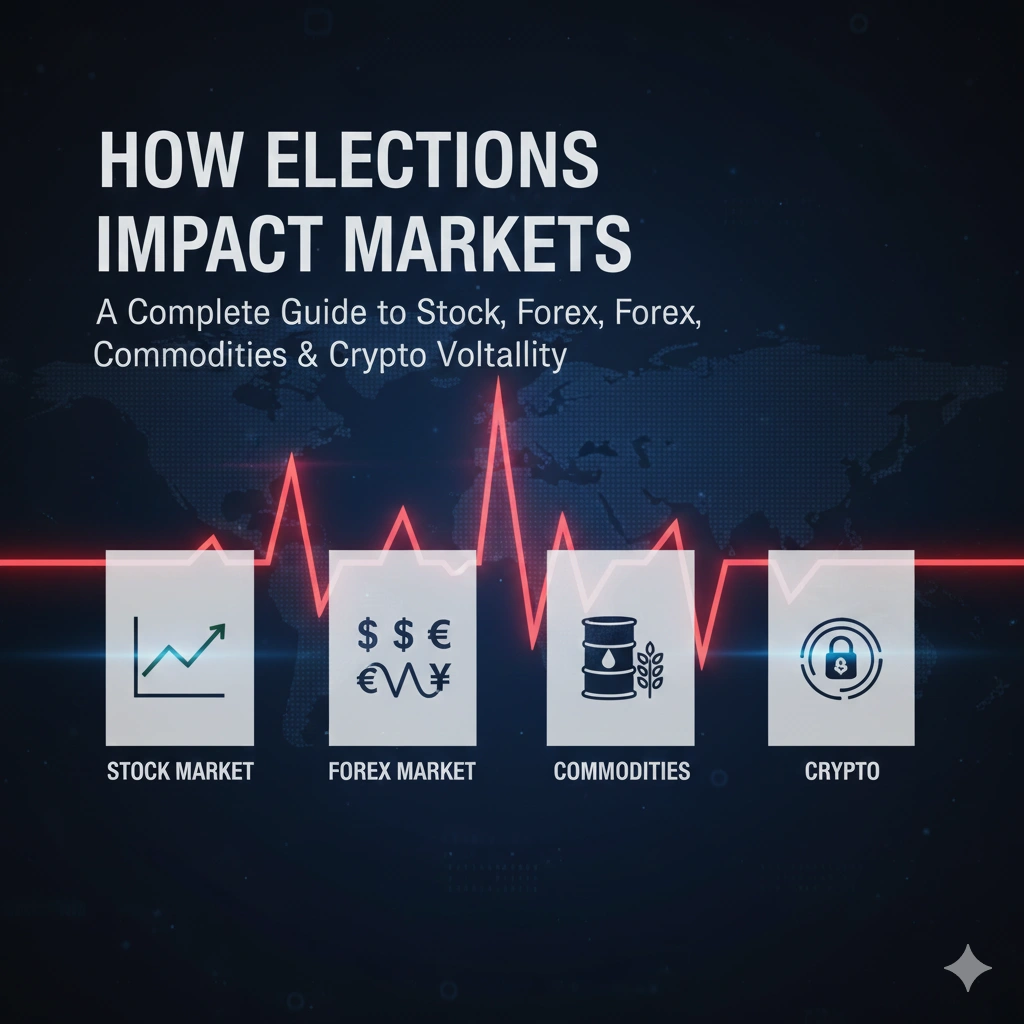
Quick Summary
When we talk about pre-FOMC market behavior, it refers to the unique price action patterns, fake breakouts, volatility changes, and liquidity traps. In this guide, we are going to learn:
- Why does the market behave strangely before the FOMC
- How EURUSD, Gold, NASDAQ, and US30 move differently
- Step-by-step strategies
- Mistakes to avoid and pro tips
- Real trading examples
What Is Pre-FOMC Market Behavior, and Why Does It Matter?
In the world of trading, pre-FOMC market behavior is the “calm before the storm.” FOMC stands for Federal Open Market Committee. It is very important because it shows how major financial institutions, banks, and professional traders prepare for one of the most powerful economic events in the world.
Pre-FOMC market behavior matters because with its help it, you can protect your capital by avoiding emotional mistakes and recognizing potential high-probability setups. Simply, it gives you an edge over most retail traders who trade blindly.
Why Does the Market Act Weird Before FOMC?
| Reason | Market Reaction |
| Banks closing positions | Low liquidity |
| Institutions collecting liquidity | Fake breakouts |
| Retail overtrading | Choppy price |
| News uncertainty | Tight ranges |
| Algorithm accumulation | Sudden spikes |
Which Assets React Most Before FOMC?
| Instrument | Reaction |
| EURUSD | Fake breakouts |
| US30 | Tight consolidation |
| NAS 100 | Sudden stop hunts |
| Gold | Slow compression |
| USDJPY | Liquidity sweeps |
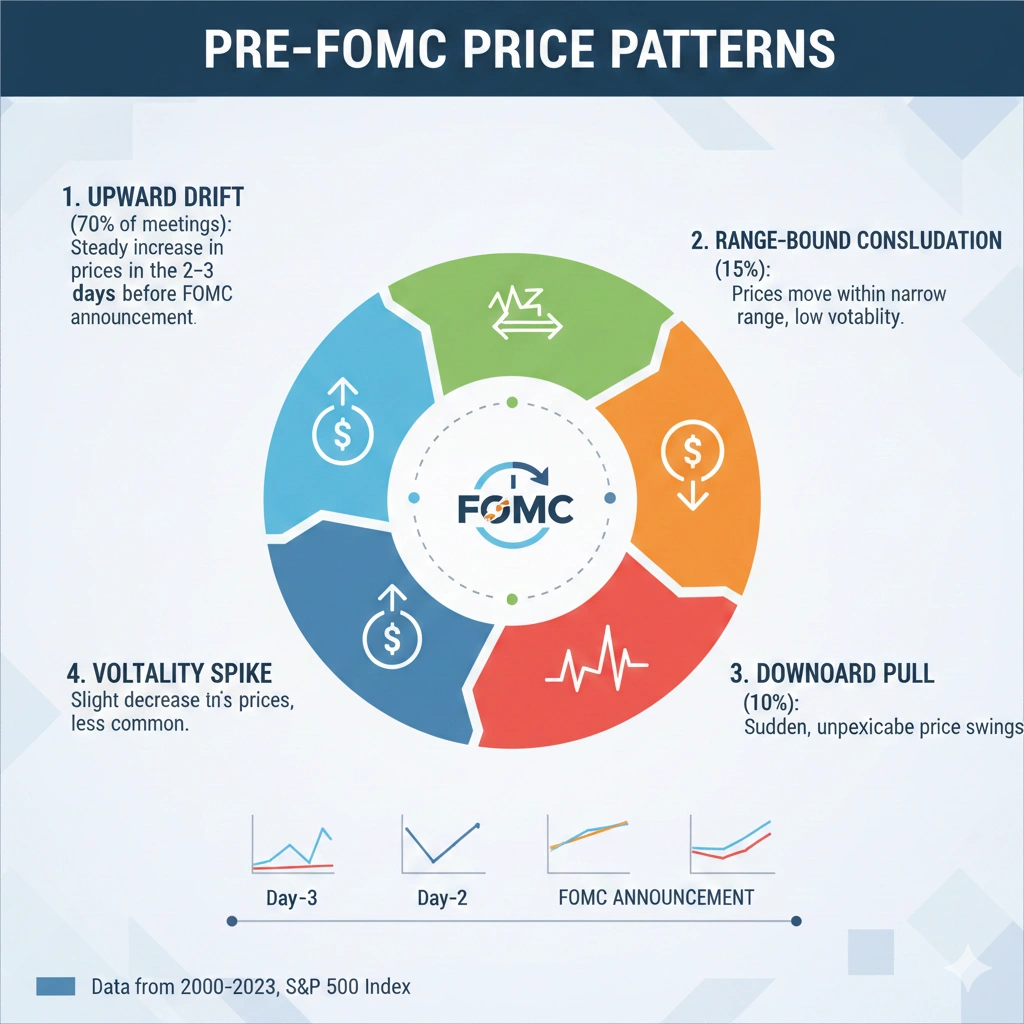
What Are the Most Common Pre-FOMC Price Patterns?
If we look for the most common pre-FOMC price patterns, there are certain price patterns that repeat consistently. Here are the most common ones.
- Range Compression
It occurs when price moves within a tight channel before the announcement of FOMC.
- Liquidity Grab
At the time when the market deliberately pushes above resistance or below support to trigger stop-loss orders from retail trades, a liquidity grab happens.
- Fake Breakouts
It is very common for prices to appear to break above resistance or below support that lures traders into thinking a new trend is starting.
- Sudden Spikes and Reversals
These are sharp price movements that appear out of nowhere during the pre-FOMC phase and are usually caused by algorithmic orders. It is extremely common in forex before FOMC meeting sessions.
- Tight Wicks and Candle Rejections
It is a clear sign that institutions are defending liquidity zones, and the market is not ready to trend yet.
If you understand these patterns, it will help you to avoid traps, and you can prepare for the post-FOMC directional move with more confidence.
How Can Traders Identify Pre-FOMC Market Behavior?
Identifying pre-FOMC market behavior is a skill that protects you from unexpected losses. Here is a step-by-step process for what you are looking for:
- Check the economic calendar first
- Notice tight price ranges
- Watch for long wicks and rejections
- Identify previous highs and lows
- Spot sudden spikes and quick reversals
- Feel the volume shift
In case you see two or more signs together, you are likely in a pre-FOMC market phase. Now this is a time when you need to go slow and protect your capital.
Real Trading Example – EURUSD Pre-FOMC
| Level | Price |
| Previous High | 1.0840 |
| Previous Low | 1.0790 |
| Fake Breakout | 1.0855 |
| Reversal Zone | 1.0830 |
| Drop | 1.0770 |
The result is an 85-pip move after a stop hunt.
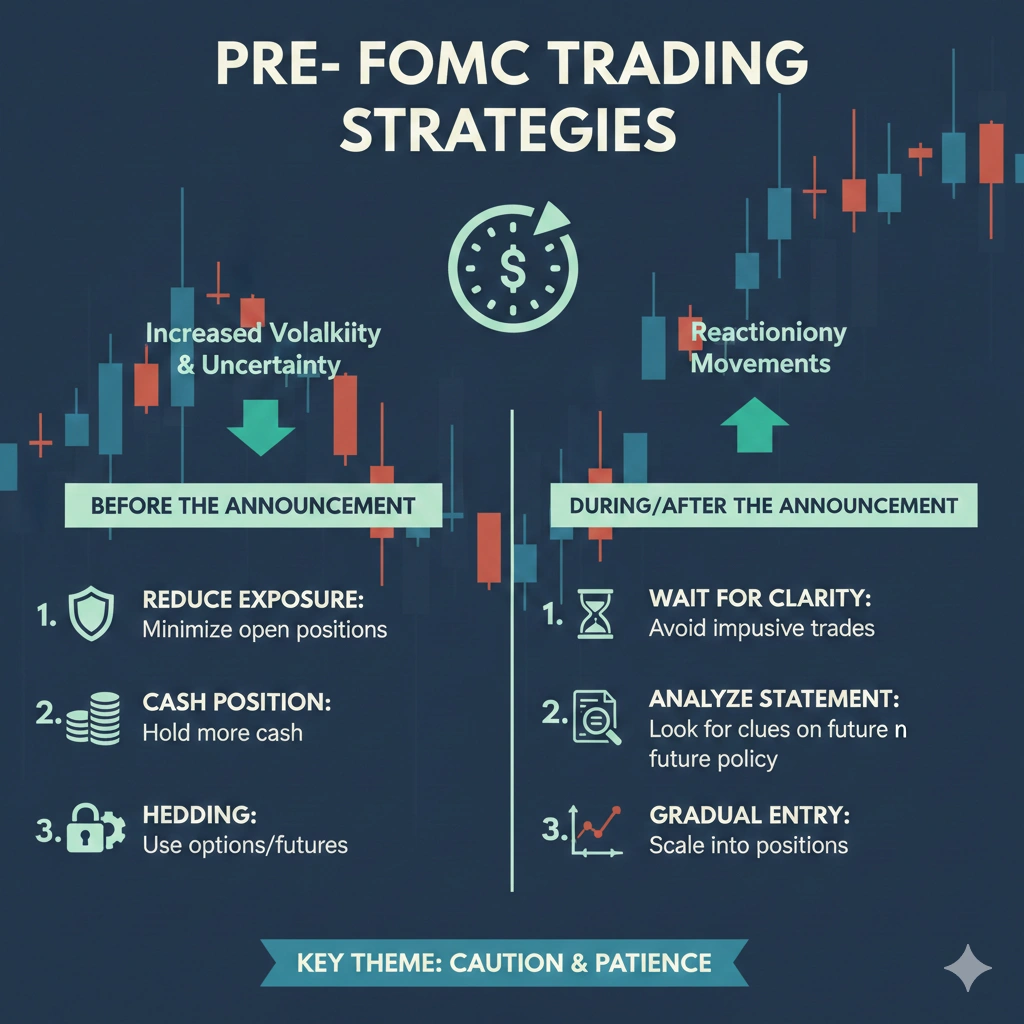
How Should You Trade During Pre-FOMC Market Behavior?
Pre-FOMC is the time to trade smartly instead of trading aggressively. Always keep in mind that your goal is not to choose profits only, but to protect your capital and prepare for the opportunity in reality. Here is a step-by-step trading approach; let’s break it down:
- Trade smaller than usual and reduce your lot size by 30-50%.
- Avoid breakout trading because most breakouts are fake, occurring before the FOMC.
- Mark liquidity zones because these levels often become targets for liquidity grabs.
- Use wider stop losses to avoid getting hunted by sudden spikes.
- Focus on observation over action to watch how the price reacts and which levels repeatedly reject the price.
- Wait for the real move after the news.
Pip Value & Lot Size Table
| Lot Size | EURUSD Pip Value |
| 0.01 | $0.10 |
| 0.10 | $1 |
| 1.00 | $10 |
Formula Used
Here is a formula for risk that tells you how much money you are allowed to lose on a single trade.
The Risk Formula
Risk per Trade = Account Balance * Risk Percentage
As an illustration, let’s assume that your trading capital is ₹200,000 and you want to risk only 1% per trade.
Then, ₹200,000 * 1% = ₹2,000
Now, regardless of what happens in the market, you will lose no more than 2,000. By using this formula, you can protect your account from being wiped out.
Pro Trader Tips
Here are some tips for you for pre-FOMC market behavior. Let’s see together.
- You should mark your previous day’s high and low. The reason is that these levels almost always become liquidity targets.
- Reduce your lot size and widen your stop-loss slightly, as this will protect you from stop-hunt candles and sudden spikes.
- Stay disciplined and be patient because the best opportunities usually appear after the FOMC release.
- To be prepared for news volatility, always check the economic calendar more than once.
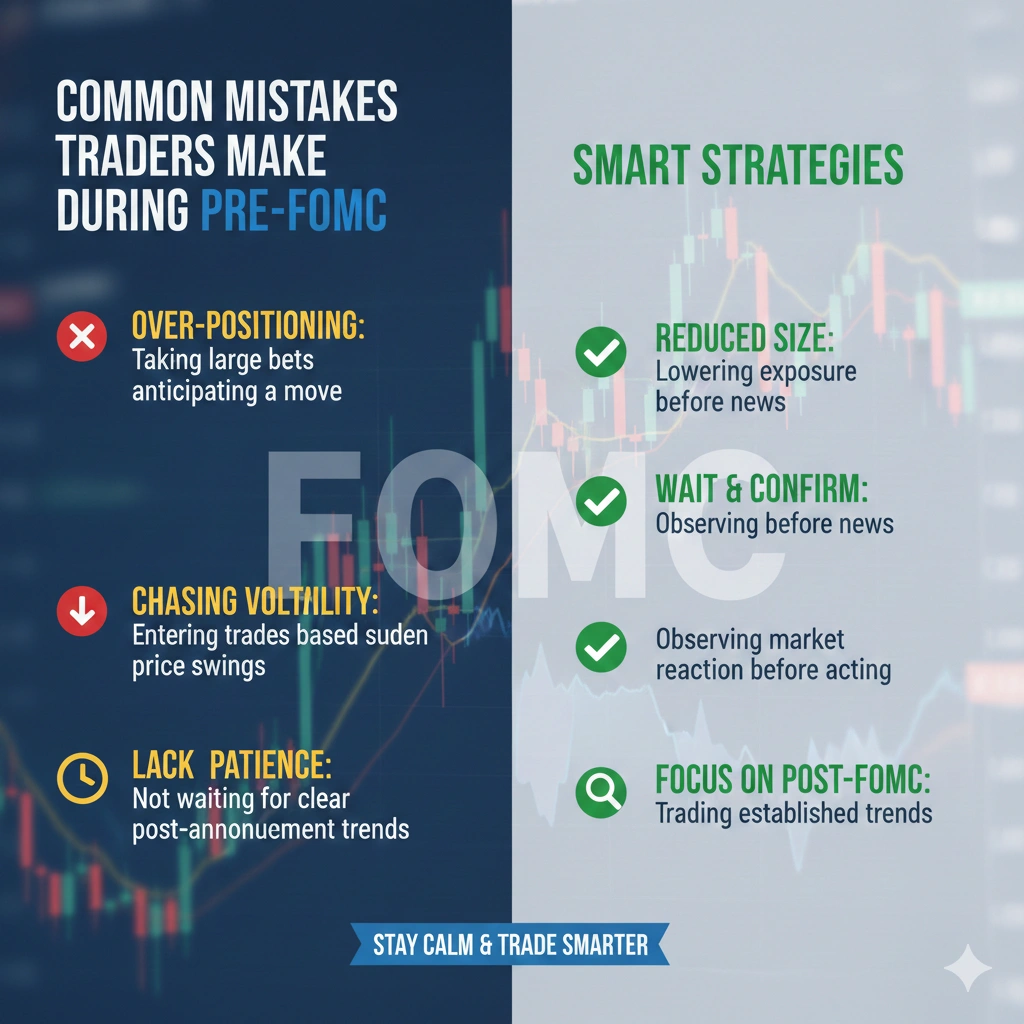
Common Mistakes Traders Make During Pre-FOMC Market Behavior
On the chart, it will look harmless, but this phase can be dangerous because of some mistakes made by you. Here are the most common mistakes that you made, which resulted in quietly destroying your accounts:
- Over-Trading Out of Boredom
- Trusting Every Breakout
- Using Tight Stop Losses
- Ignoring the Economic Calendar
- Increasing Lot Size to “Compensate”
If you avoid these mistakes, you will instantly improve the rate of your survival and also be ready for the real post-FOMC trading opportunities.
FAQs
1. What is pre-FOMC market behavior?
It describes the unique price action where markets usually move slowly inside narrow ranges, produce false breakout signals as banks, and create sudden spikes.
2. Is it safe to trade before FOMC?
It is safe to trade before FOMC only for advanced traders; it can be risky for beginners. If you have less experience, wait for the post-FOMC direction to become clear before placing trades.
3. Which asset is best to trade pre-FOMC?
Well, if you are looking for the best asset for your trade, it is EURUSD, Gold, US30, and NAS100 that show the clearest patterns.
4. Why do breakouts fail before FOMC?
When the market is not ready to reveal its true direction, breakouts often fail.
5. Can beginners trade pre-FOMC sessions?
No, generally it is not ideal for you if you are a beginner. Fake breakouts or sudden spikes can lead to unnecessary losses, so avoid it.
Final Thoughts
As a trader, it is very important to understand pre-FOMC market behavior because it can turn dangerous market conditions into profitable opportunities. It will help you to protect your capital, avoid false signals, and shift your focus towards waiting for the real high-probability trading opportunities.
If you are losing your money during this phase, don’t blame your strategy. It is because you’re trading at the wrong time and in the wrong conditions. In short, if you master pre-FOMC market behavior, you are prepared to capitalize on explosive movements. Let FOMC build long-term confidence and consistency in your trading journey.
Ready to trade pre-FOMC market behavior like a pro? Join InsightfulTrade today, which gives you access to real-time FOMC market analysis. Stop guessing and start trading with confidence.
Author: Arihant Jain
Trading Experience: 5+ Years
Arihant Jain is a financial markets analyst and trading educator with expertise in Forex, indices, crypto, and risk-managed trading systems. His insights are based on real trading experience, data-driven analysis, and transparent market understanding. All content is reviewed for accuracy and aligns with Google’s EEAT guidelines.
Risk Disclaimer:
Trading involves substantial risk. All information is for educational purposes only and should not be taken as financial advice. Always do your own research.
Last Updated: 06 January 2026