Introduction
Whenever you stood in front of a price chart and thought that those small candles were out to tell you something, this candlestick patterns guide will assure you that things will finally make sense. Imagine candlesticks as the body language of the market; once you learn to interpret them, it becomes much easier to see when the market is in a downward trend, when it reverses, and when there is an intraday opportunity.
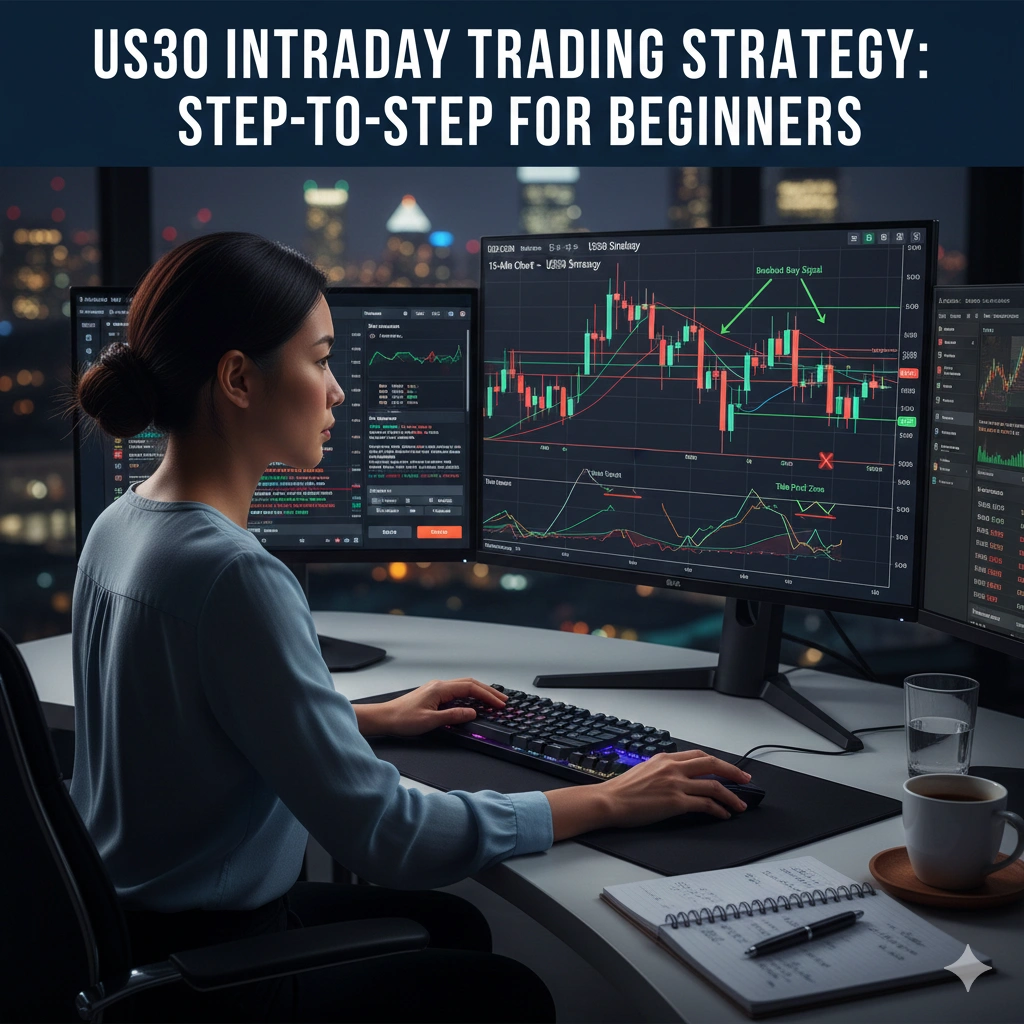
We will also take a step-by-step walk through the most helpful patterns in this guide, such as a list of the easiest-to-use bullish patterns, the most dependable bearish signals on an intraday, an actual example of pairs, such as EURUSD, and speedy moving indices, such as US30.
It’s like being introduced to the world of trading or like having a better understanding of the market, the space between entries and exits, and knowing your place in it.

What is the ultimate candlestick patterns guide for traders?
In case you are still confused about this topic, here is a brief candlestick patterns guide that will make all of it sound much easier. Candles are simply how the market lets you know who is dominating the market, the buyers or the sellers, and once you get to know a couple of simple formulas, charts become a lot easier to read.
You either need a simple list of bullish patterns, or you want to identify clear bearish signals to trade intraday, but not to excessively think about the matter at hand.
What is a candlestick, and why does it matter?
Learn the candle basics.
The first step is to start with what each candle represents: open, high, low, and close. It is what any candlestick patterns guide is all about.
Watch the wicks and bodies.
Wicks’ rejection, the body’s momentum. This is the way you get early signs of bearishness in intraday movements.
Stick to simple patterns.
To ensure stress-free use, a simple bullish patterns list, such as hammers engulfing candles.
Always check the context.
Patterns are effective with Trend and support. It is at this point that it starts to become comprehensible.
Which candlestick patterns are most important—what are the bullish patterns?
- Any candlestick pattern guide will start with a simple list of bullish patterns.
- Buyers can identify buying pressure with only a few patterns, such as the hammer, bullish engulfing, and morning star patterns.
- They perform best when in an uptrend or close to support, so it is always good to look at the context.
- Apply them in such a manner that it is then much easier to take clean upward moves.
Which patterns indicate bearish signals for intraday trading?
- An effective candlestick pattern guide makes it very simple to identify bearish signals intraday.
- The shooting star, bearish engulfing, and evening star are the key ones.
- There is also dark cloud cover, a tweezer top, and 3 black crows, suggesting sellers are gaining dominance.
- These signals are much more credible with the help of a fast recognition candle.
How do I read a single candlestick—what do the body and wicks tell me?
- Check the trend
Bullish patterns operate in an uptrend; bearish in a downtrend—that is all.
- Look at key levels
The patterns, such as hammers or shooting stars, are much stronger when supported and resisted.
- Watch momentum
A strong push is the confirmation of the move, and weak candles are normally noisy.
- Wait for confirmation
The following indicates whether buyers or sellers intended to do business, particularly on bearish intraday trade signals.
What step-by-step process should I use to trade a candlestick pattern?
Candlestick pattern guides make for good and simple trading.
- Identify pattern: Intraday bearish setups or bullish patterns—look for hammer, bullish engulfing, shooting star, or other patterns on a list of bullish patterns.
- Check confirmation: Use volume, RSI, or greater time period trends to confirm.
- Plan entry and risk: Enter on confirmation, place a stop loss towards the wick, and control position size.
- Control the trade: trailing stops, partial profits, or exit on other patterns.
- Check trades: Keeping track of the number of wins and losses will enable you to find your advantage over time.

How do I calculate position size and pip value?
Position size and pip value are two of the crucial steps to be able to follow a candlestick patterns guide. This will assist you in trading and dealing with risk.
| Instrument | Standard lot | Pip/point | Value per lot |
| EURUSD | 100,000 | 0.0001 | $10 per pip |
| GBPUSD | 100,000 | 0.0001 | $10 per pip |
| USDJPY | 100,000 | 0.01 | ~$9-10 per pip |
| US30 | Varies | 1 point | ~$1-$10 er point |
How to compute position size:
Position size (lots) = Account Risk $ ÷ (stop loss in pips × pip value)
As an example, would you risk 1% of your account (that is, $50) on a 20-pip stop in EURUSD?
Lots = 50 ÷ (20×10) = 0.25 lots
Can you show numerical examples with EURUSD and US30?
The best candlestick patterns guide is the one that demonstrates how patterns are converted into actual trades.
EURUSD: A hammer forms at 1.0750. Enter 1.0760, stop 1.0740 (20 pips), target 1.0820 (60 pips). Risk-to-reward = 3:1
US30: Bullish engulfing at 39,200. Enter 39300, stop at 39150 (150 points), and target 39900 (600 points). Risk-to-reward = 4:1.
The lesson? Identify the trend, verify it, and establish a stop loss and target; that is how you can trade Bull and bear signals safely and with great precision, as far as intraday arrangements are concerned.
What are the pros and cons of trading candlestick patterns?
| Pros | Cons |
| Simple to understand – There are a few sellers and buyers visible on the chart | It is capable of sending misleading signals in the choppy or sideways markets. |
| Trade in forex, indices, and commodities | Wind check; trends are not sufficient. |
| Essential in making fast decisions in a day. | It takes practice to interpret correctly. |
| It may be used along with such indicators as RSI or moving averages. | Bad trades can occur because of emotional prejudice. |
Which technical confirmations strengthen candlestick signals?
Volume: Large spikes indicate actual buying pressure or selling pressure.
Trend: Trend following at the higher time frame is more accurate.
Momentum: This indicates reversal signals by adding strength to reversal signals from the RSI or MACD divergence.
Support/resistance: Trends around major positions are more significant.
Moving Averages: Above/below 50 MA adds confirmation.
What are the pro tips from my trading experience?
- Wait until the pattern has been closed after one candle.
- Compare between periods of time: 15 15-minute patterns and 1-hour trends.
- Keep small changes at a max of 0.5 – 1% per trade.
- Log trade patterns, entry, exit, and result of trade.
Do it, and your bullish patterns list or bearish signals of intraday setups will increase in value.
What common mistakes should be avoided when using this candlestick patterns guide?
- Never trade any single candle; always need to recheck the trend, support/resistance, and higher timeframes.
- Maintain risk at a small size and take into consideration spreads or slippage; overleveraging erases profits.
- Find follow-through after patterns before committing; confirm.

Faqs
- Can I trade candlestick patterns alone?
Yes, but it is better when used together with support/resistance, volume, and risk management.
- How much should I risk per trade when trading candlestick setups?
Mostly, it is 0.5-1% per trade of account, although it adjusts to your backtesting/edge.
- Do candlestick patterns work on indices like US30?
Yes, they use indices but consider pip as points and consider various volatility and tick values.
- How do I avoid false signals?
Demand confirmation (additional candle/volume), do not trade into the major news, and prefer setups that are more consistent and longer-term trends.
Conclusion
To recap on this guide on candlestick patterns, the most important thing that will help you as a trader to become a profitable trader is how you interpret the patterns, ensure they are correct, and manage risk. A basic list of police patterns and an understanding of bearish signs in intraday trades will provide you with a structure, but it is the context, trend direction, support and resistance levels, volume, and momentum that will give you an advantage.
Add in the correct position sizing, the correct position stops, and the correct risk management, and then the charts will begin to make sense. The best part? Learning how to do it, you will learn to see the entries and exits and almost be able to touch them.
Ready to decode market moves with confidence? Download InsightfulTrade’s Candlestick Patterns Guide and start reading price action like a pro. Master patterns, improve timing, and trade smarter today!
Author: Arihant Jain
Trading Experience: 5+ Years
Arihant Jain is a financial markets analyst and trading educator with expertise in Forex, indices, crypto, and risk-managed trading systems. His insights are based on real trading experience, data-driven analysis, and transparent market understanding. All content is reviewed for accuracy and aligns with Google’s EEAT guidelines.
Risk Disclaimer:
Trading involves substantial risk. All information is for educational purposes only and should not be taken as financial advice. Always do your own research.
Last Updated: 3 December 2025