Assuming you have been studying technical analysis, you would probably have come across the RSI indicator in almost every trading system. Though most traders are aware of what it is, a few of them know how to apply the RSI indicator in actual forex trading. In this guide, we decipher the RSI indicator mechanism, its indicators in live markets, and how the indicators are used by market veterans to enter and exit at the right time with live, no-bull-crap trading techniques that you can use today.
Key takeaway
- The RSI indicator does not indicate direction but momentum and is used to identify overbought/oversold levels.
- The 70/30 levels will help to find out the extremes, yet it is worth confirming.
- The 50-line is important in determining the direction of the trend.
- Optimal results are achieved using RSI in conjunction with price action and support/resistance.
- A high RSI divergence signal is a powerful reversal signal.
What Is the RSI Indicator?
The RSI (Relative Strength Index) is a momentum oscillator, which was developed by J. Welles Wilder Jr. in 1978 and published in New Concepts in Technical Trading Systems. It is extensively applied in forex trading.
The RSI indicator does not gauge the direction of price movement; it gauges the speed and strength of the price movement. This assists traders in knowing the market momentum.
RSI can often be used as a leading indicator and can indicate potential reversals and early entries in forex trading.
How RSI indicator works—the math explained simply
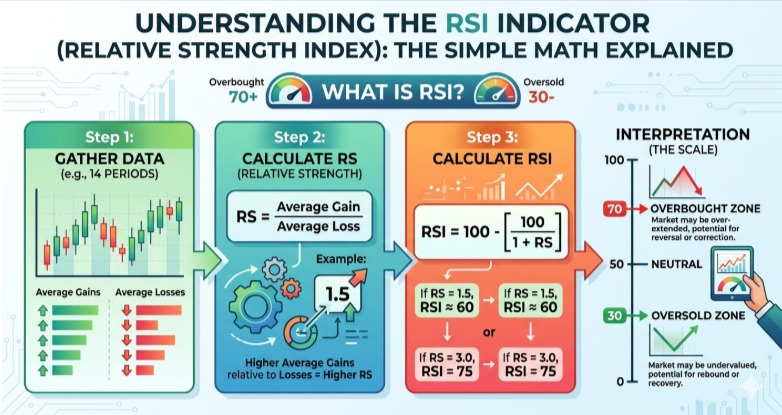
The first step towards applying the RSI indicator in forex trading is to understand how the RSI indicator works. It is a comparison between the mean gains and the mean losses in a given time period (typically 14 candles).
RSI formula: RSI = 100 − [100 ÷ (1 + RS)], where RS = Average Gain ÷ Average Loss.
The value remains within 0 and 100. Buy pressure moves the RSI towards 100, and the selling pressure moves towards 0. Oversold and overbought conditions are normally spotted at levels 30 and 70.
How to read RSI values
RSI is a trading indicator that includes a value of 0 to 100, which is used to recognize momentum in forex trading.
- Above 70 (Overbought): Intense buying; there can be an overextended price that is ready to be pulled back, though trends do not have to be any lower.
- Below 30 (Oversold): Great selling power; the price could be oversold and is poised to go up; however, this should be confirmed.
- Midpoint (approximately 50): Significant level of trend—The trend line above 50 indicates a bullish control, and the trend line below 50 indicates a bearish control.
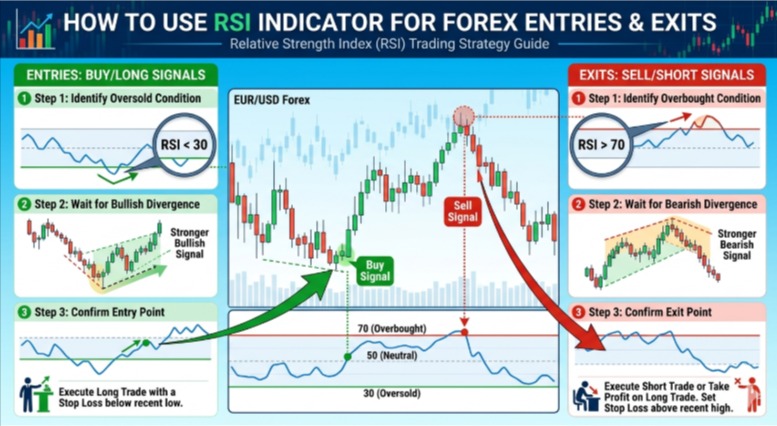
Using RSI for forex entries
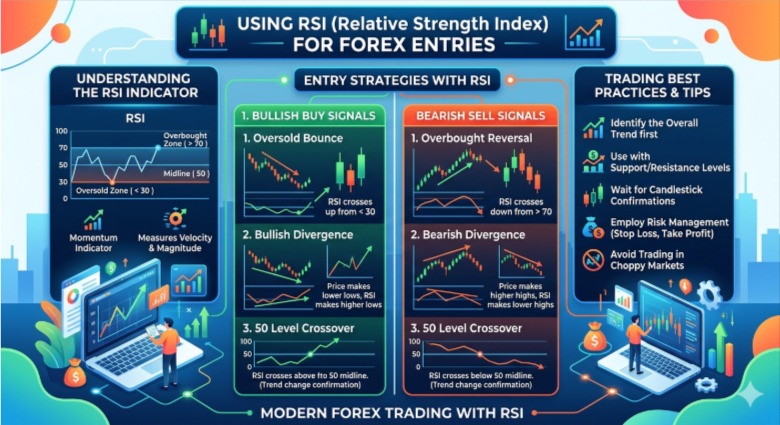
It is at this point that the RSI indicator can be used in practice in making real-trading decisions. The following are four easy methods of using it to enter the forex:
1. Bounce entry, oversold (Range Markets)
The falling of the RSI indicator below 30 in a sideways market could be an indicator of exhaustion of selling. Only go into it when RSI goes back over 30 so that people can be sure of it, rather than when it first drops.
2. Trend-Following Entry (50-Line Strategy).
In trends, emphasize the 50 rather than the 30/70. During an uptrend, RSI pullbacks around 40-50 may provide an opportunity to buy when the RSI starts to rise once again.
3. RSI 50 Crossover Entry
Once the RSI indicator breaks above 50, it is a positive indication of strengthening bullish momentum and vice versa. This aids in capturing early fads.
4. RSI + Support/Resistance Confluence
The most powerful constructions take place when the RSI coincides with the main support or resistance areas. This mix augments the credibility of the forex entries.
Using RSI for forex exits
The RSI indicator can also be applied to the forex trading to make entries and exit the trade as well as guard profits.
1. The exits at overbought/oversold levels.
When you are trading on a buy and the RSI reaches higher than 70, then it might be an indication of a slowing down of momentum, and it will be an ideal time to make some profits. The same will be the reverse with a score below 30.
2. RSI Failure Swing
RSI indicator failure swing occurs when RSI is not able to generate a new high (or low) and it breaks structure, indicating the exhaustion of momentum. This usually is a powerful give-up sign.
3. RSI Divergence Exit Signal
When price experiences a new high but the RSI experiences a lower high, then it is a bearish divergence. This is one of the major indications to close or sell out positions prior to turning around.
RSI divergence — a powerful signal
One of the surest indicators of the RSI indicator is RSI divergence, which indicates when the price and the momentum are moving in opposite directions and indicating a potential reversal or continuation.
Bullish Divergence
Price makes a lower low with RSI making a higher low. This indicates that the selling pressure is weak, and there may be buying interest—a good buy sign just before a support.
Bearish Divergence
Price makes an elevated high, whereas RSI makes a reduced high. This will mean a loss of bullish momentum and a potential pullback or reverse at resistance.
Unrecognized Divergence (Continuation Signal)
The hidden divergence is an indication of continuity of trends. When the market is bullish, the price will increase its lows, whereas the RSI will decrease its lows, indicating that the uptrend will probably persist.
Best RSI settings for forex
The settings of the RSI indicator will vary according to your style and trading time in trading. The default 14-period is most widely applied, with performance being enhanced with changes.
| RSI period | Best for | Signal frequency | Noise level |
| RSI 7 – 9 | Day trading, scalping (M15–H1) | High | High — more false signals |
| RSI 14 | Swing trading (H4, Daily) | Moderate | Balanced — most widely used |
| RSI 21 | Position trading (Daily, Weekly) | Low | Low — smoother, fewer signals |
Adjusting Levels (70/30 vs. 80/20): 80/20 has been employed by many traders in volatile markets where the 70/30 is not effective in order to minimize false signals, whereas 70/30 is more effective under normal market conditions.
Common RSI mistakes to avoid
1. Buying Just Because RSI is Below 30
RSI is also allowed to remain in the oversold condition during a strong downtrend; hence, it is always necessary to wait till confirmation, such as a cross above 30.
2. Using RSI Alone
The RSI indicator cannot be used alone but rather with price action or support/resistance.
3. Ignoring the 50 Line
One important trend direction filter that is missed by many traders is the 50 midline.
4. Fighting the trend
Do not sell because RSI is overbought in a good uptrend; it is possible that momentum can remain extended.
5. Making Too Many Changes in the Settings.
Maximization of the RSI setting decreases the consistency. Always use the same setup that suits you.
Conclusion
The RSI indicator is an easy but effective instrument to comprehend the momentum in forex trading. Once you understand how to use RSI indicator properly, it assists in identifying overbought and oversold areas, verifying trends, and enhancing the timing of entry and exit. It works best when used in conjunction with price action and support/resistance and not by itself. It can greatly enhance your trading choices with practice.
Prefer to get more insights like this? Learn about the RSI indicator, forex strategies, and smarter trading choices with the help of the knowledgeable guides on Explore InsightfulTrade.
FAQs
- What is the RSI indicator used for in forex?
The RSI indicator helps in the determination of overbought/oversold zones, verifies the trends with the 50 line, and identifies entry/exit points with the help of momentum.
- How does the RSI indicator work?
The RSI indicator is used to compare the average gains and losses in 14 periods and indicates a value of 0-100. Above 70 is overbought, and below 30 is oversold.
- What is the best RSI setting for day trading?
RSI 79 provides quick indications, and the most frequent and dependable is RSI 14, which applies to day trading.
- Can RSI be used alone?
No, the RSI indicator can be best used with the help of either support/resistance or the price action to prevent false signals.
- What is RSI divergence?
RSI divergence occurs when the prices and the RSI move in opposite directions, and in most cases, this may indicate an impending reversal.
Author: Arihant Jain
Trading Experience: 5+ Years
Arihant Jain is a financial markets analyst and trading educator with expertise in Forex, indices, crypto, and risk-managed trading systems. His insights are based on real trading experience, data-driven analysis, and transparent market understanding. All content is reviewed for accuracy and aligns with Google’s EEAT guidelines.
Risk Disclaimer:
Trading involves substantial risk. All information is for educational purposes only and should not be taken as financial advice. Always do your own research.