Introduction
Market crashes are defined by sudden drops in price, often caused by unexpected economic crises or political shock. A market crash case study has a high advantage, as it helps us understand the situations and prepare ourselves for the future. For traders and investors, to protect their capital, they need to understand how volatility works when the market is falling.
This article explores some of the most significant market crashes in history, providing a detailed index crash analysis and key volatility lessons for traders aiming to navigate similar future disruptions.
The Anatomy of Market Crashes: A Historical Overview
History doesn’t repeat itself, but it does tend to be the same. Most market crashes follow the same pattern—lack of liquidity, a sudden shock, and then panic. We have seen this type of crash in the last few years:
- The 2020 COVID-19 Crash: A historic collapse driven by pure uncertainty.
- The 2022–23 Global Inflation & Interest Rate Shock: Resulted in steep corrections in major indices.
- The 2023 U.S. Debt Ceiling Crisis & Banking Failures: The silicon Valley Bank collapse sparked widespread index turbulence.
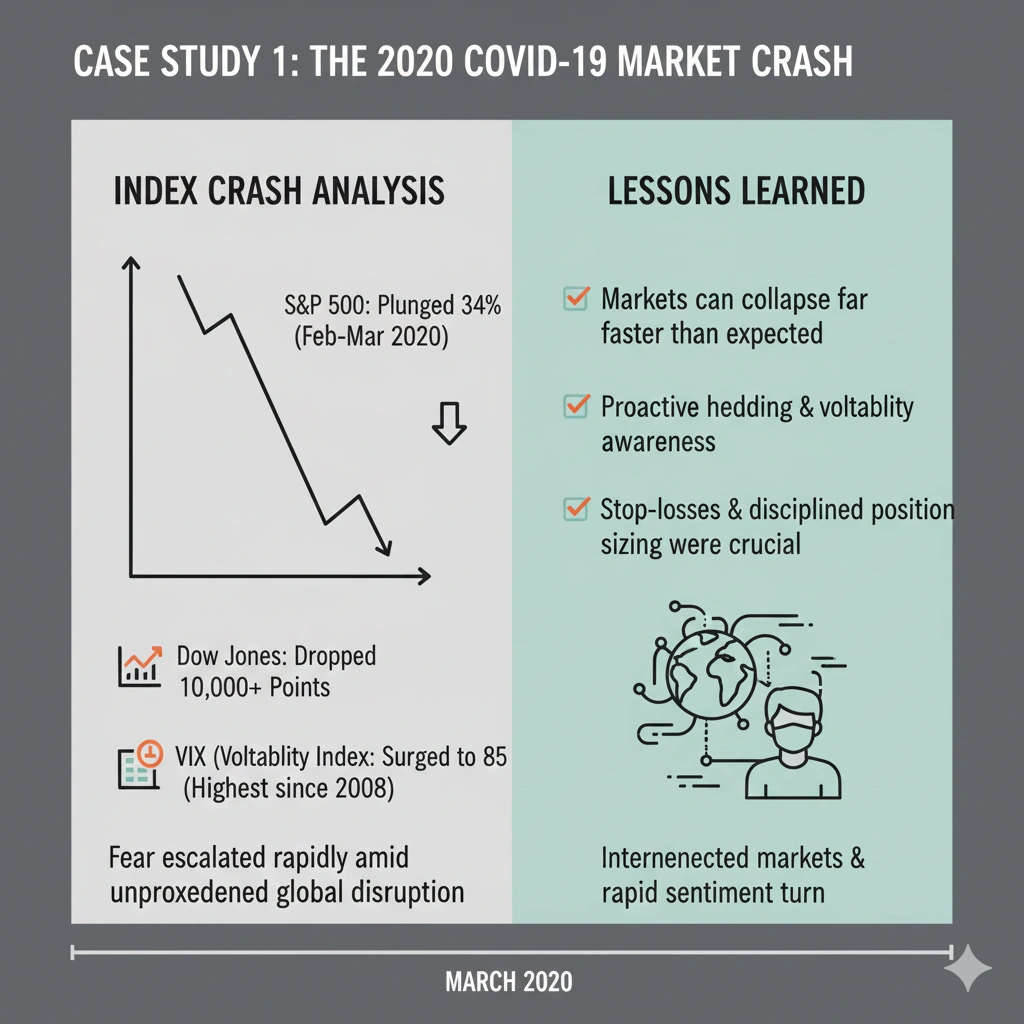
Case Study 1: The 2020 COVID-19 Market Crash
March 2020 is a month no trader can forget, as it wasn’t volatility but a complete freefall. News of lockdowns and economic shutdowns sent panic through the market. Caused a panic in the market.
Index Crash Analysis
- The S&P 500 plunged nearly 34% from its February peak to March lows.
- The Dow Jones dropped over 10,000 points in less than a month.
- The VIX (Volatility Index) surged to 85, a level we haven’t seen since 2008.
Lessons Learned
- Market falls can be really fast; you might not even get a chance to protect yourself.
- Always use proper strict stop-loss and risk management if you want to survive; otherwise, it wouldn’t take long for the market to kick you out.
- When the world is connected, the move happens more quickly, and within a night, everything can go from good to full-blown panic.
Case Study 2: The 2023 U.S. Debt Ceiling Crisis & Banking Turmoil
The start of 2023 was a perfect storm. As traders grappled with higher inflation and rising interest rates, the unthinkable happened: major banks took a hit. The collapse of Silicon Valley Bank (SVB) and Signature Bank didn’t just harm the surviving financial sector—it sent shockwaves throughout the global economy.
Index Crash Analysis
- The Nasdaq dropped sharply as tech-sector liquidity concerns rose.
- The S&P 500 saw severe intraday volatility, experiencing multi-percent swings.
- Financial sector indices plunged over 15–20% within weeks.
Traders became risk-averse as concerns about systemic failures grew.
Volatility Lessons for Traders
- This crisis proved that even the market can fall if the banks fail.
- It taught us that liquidity is the foundation of strong markets
- If you’re not keeping an eye on interest rates and bond yields, you’re missing the engine that drives the car.

Case Study 3: The 2022–23 Inflation Shock & Rate Hikes
Aggressive interest rate hikes by the Federal Reserve to curb inflation sparked a prolonged market downturn.
Index Crash Analysis
- The S&P 500 fell over 25% from its peak.
- The Nasdaq dropped more than 35%, entering a deep bear market.
- Volatility rose sharply as bond yields climbed.
Key Takeaways
- High inflation eats earnings and investor confidence.
- Rate hikes cause immediate volatility in cryptocurrencies, stocks, and forex.
- Traders must understand macroeconomic cycles to forecast risk.
Understanding Volatility in Market Crashes
Volatility is the defining characteristic of every market crash. It reflects rapid price swings, uncertainty, and extreme emotional reactions among traders.
What Is Volatility?
Volatility measures how dramatically prices change over time. It comes in two forms:
- Historical volatility – based on past price movement
- Implied volatility – based on market expectations of future swings
During a crash, both spike simultaneously.
Volatility Behavior During Crashes
- Liquidity dries up as traders move to safe assets.
- Sharp price gaps appear on charts.
- Bid-ask spreads widen significantly.
- Panic-driven orders overwhelm normal trading flow.
Key Tools for Volatility Analysis
Traders often use volatility tools to navigate market stress:
- VIX (Volatility Index)
This tracks the expected volatility of the S&P 500. High readings tell you that panic is driving the market.
- ATR (Average True Range)
Use the Average True Range to measure the market’s ‘heartbeat.’ If the ATR is high, give your stop-losses more room to breathe.
- Bollinger Bands
These expand when the market is volatile. Watch for them to widen significantly—it’s often a signal that a breakout or reversal is in play.
Volatility Lessons for Traders
Trading in a volatile market is not about being a hero; it is about survival. Here’s what traders should do to survive:
- Keep a safe and small position size so that you can survive during the volatile market
- During this kind of market, use a wider stop loss to stay in the game; otherwise, you will easily get kicked out of it.
- Diversify into assets that don’t move much during such a market.
- Panic is common during such periods, but avoid letting it make your decisions; stick to your plans.
Regulatory and Policy Lessons From Modern Crashes
Recent market events highlight the need for strong financial systems:
- With the circuit breakers you can pause the trading to avoid panic selling.
- After the case of SVB, regulators became stricter over the banks.
- New rules ensure that banks have enough liquid cash to handle sudden crashes.
- Transparency reforms help avoid misinformation.
Even across the borders, new rules & regulations have been brought to manage risks.
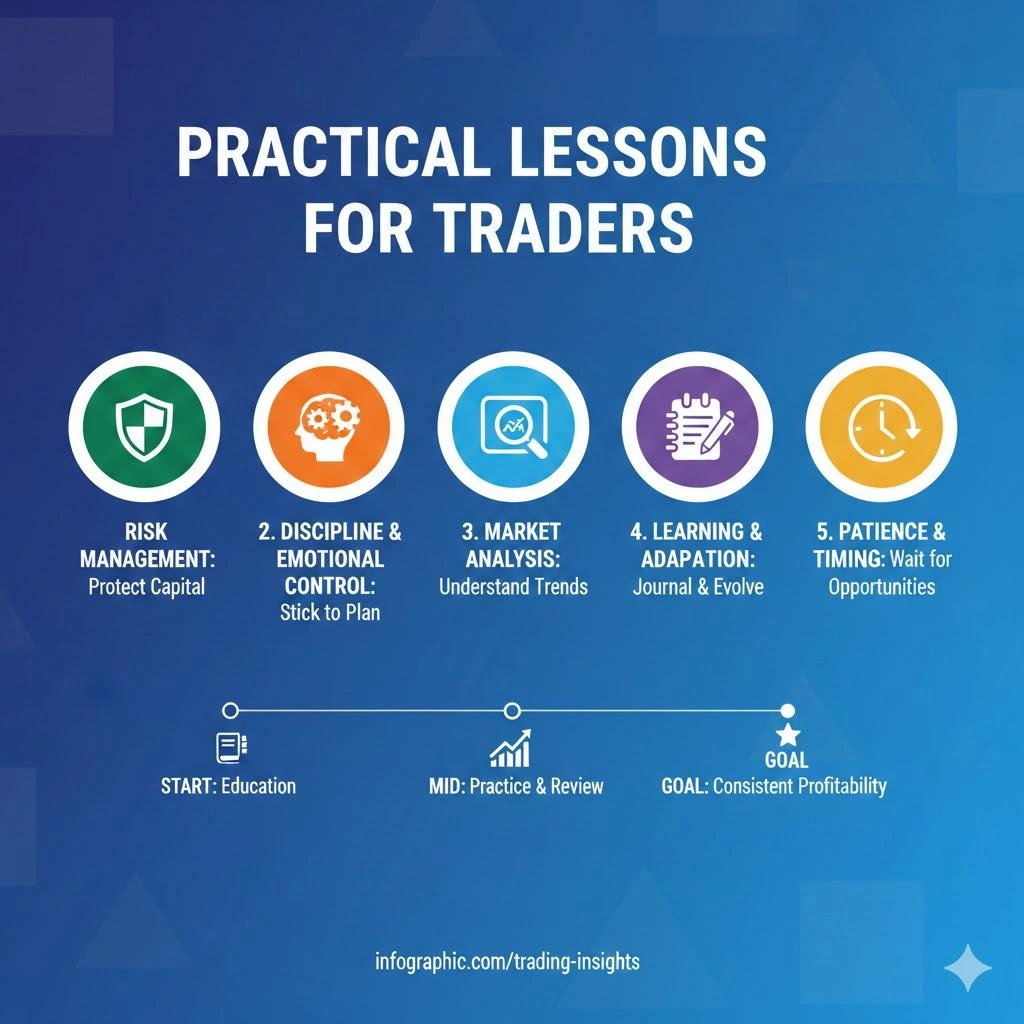
Practical Lessons for Traders
The survival guide for traders:
- Build a diversified portfolio capable of withstanding shocks.
- Use volatility tools to see danger in market conditions.
- Do not ignore macro news, as even inflation and rates move the market.
- Selling during the volatile market is the worst mistake; avoid it and stay disciplined with your trade.
- Do not let your emotions plan your moves in trading.
Final Thoughts
If market crashes teach us anything, it’s that certainty doesn’t exist. But preparation does. It’s not that by studying past crashes we can prevent the market from crashing, but we can be prepared and stop managing our portfolio to avoid risk. Instead of fearing the volatility, you can stay calm, manage risk, and adapt; the trader who can do this will last long.
InsightfulTrade provides expert guidance and easy-to-understand educational resources that help you build stronger strategies based on the historical patterns and modern analysis. With InsightfulTrade’s support, you can create solid trading plans, improve your ability to handle volatility, and stay a step ahead even when markets become unpredictable.
FAQs: Market Crash Case Study & Volatility Lessons
Q1: What is a market crash case study?
A market crash case study examines real historical market declines to understand their causes, outcomes, and lessons for traders.
Q2: Why is this analysis important?
It helps you spot danger in the market. By understanding how crashes happen, you can make strategies to stay safe during the crashes by using stronger risk management.
Q3: What causes market crashes today?
There could be a variety of reasons behind compensation, such as pandemics, interest rate hikes, lack of inflation, geographical risks, or major institutional failures.
Q4: What rule changes were brought about after recent crashes?
Authorities have added some safety rules to protect traders, like stricter rules for banks, better liquidity requirements, and limits on over-circuit breakers to reduce extreme panic.
Q5: How can I protect myself during volatile index moves?
Be sure to use stop-losses in volatile markets, manage liquidity measurements, use volatility indicators, and maintain discipline to avoid unnecessary positions.
Author: Kumkum Chandak
Experience: 3+ Years in Trading Research & Market Content Strategy
Kumkum Chandak is a trading content strategist and market research writer who specializes in simplifying technical analysis, trading tools, and strategy-driven educational content. Her work is optimized for EEAT, accuracy, and user intent, ensuring every article delivers practical insights for traders of all levels.
Risk Disclaimer:
All content is strictly educational and not financial advice. Trading involves substantial risk. Always perform your own analysis or consult a professional advisor.
Last Updated: 5 December 2025