Elections don’t just decide governments — they move markets. From sharp swings in the S&P 500 to currency crashes in emerging markets, elections impact markets across every asset class. Understanding why — and how to position before it happens — is what separates reactive traders from strategic ones. This guide breaks down the mechanics, historical data, sector patterns, and proven strategies behind election-driven market movements.
What Does It Mean When Elections Impact Markets?
Elections impact markets because financial markets are forward-looking — they don’t wait for results to react. The moment election campaigns begin, traders start pricing in expected policy changes before a single vote is cast.
When a new government is anticipated, investors immediately adjust their positions based on projected changes in:
- Corporate tax rates — lower taxes boost company earnings; higher taxes compress margins
- Government spending — stimulus or infrastructure plans drive sector-specific rallies
- Trade tariffs — new trade policies directly affect export-heavy industries and currency pairs
- Interest rate policy — fiscal direction signals to central banks, moving bond and forex markets
- Regulatory frameworks — stricter rules can pressure banking, energy, or tech sectors overnight
This collective reaction creates what analysts call the policy uncertainty premium — extra risk built into asset prices that stays elevated until the election outcome is confirmed and a clear policy direction emerges.
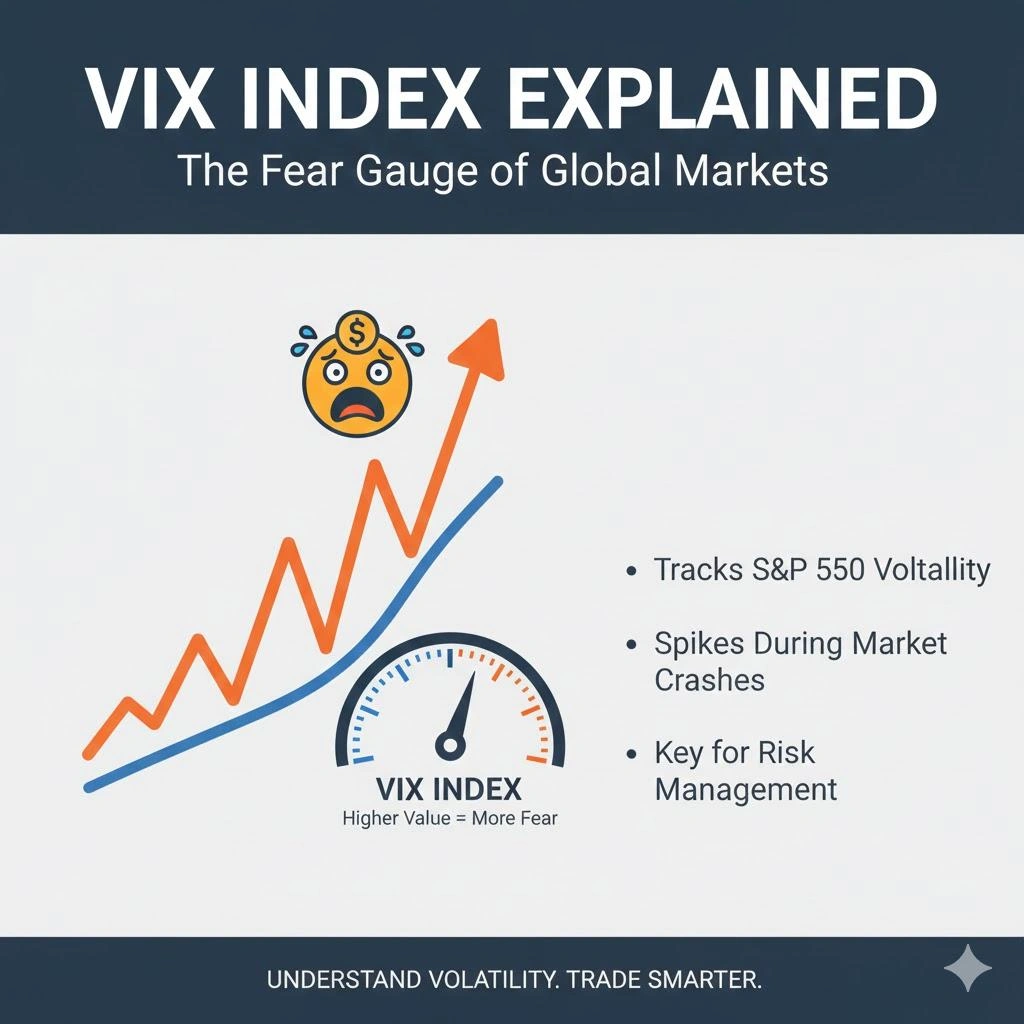
Simply put: Markets hate uncertainty. Elections are one of the biggest sources of uncertainty in any economy — which is exactly why the election cycle effect on stock market returns is so well-documented across decades of data.
The VIX index (also known as the Fear Index) is the clearest measure of this. Historically, the VIX spikes noticeably in the weeks leading up to major elections — reflecting rising market volatility during elections — and drops sharply once results are declared and uncertainty clears.
Presidential Election Cycle Theory Explained
One of the most important — yet least discussed — concepts when studying how elections impact markets is the Presidential Election Cycle Theory.
First popularized by Yale Hirsch in the Stock Trader’s Almanac, this theory suggests that stock market performance follows a predictable 4-year pattern directly tied to election cycles. Understanding this pattern can give traders and investors a significant timing edge.
Here’s how the 4-year cycle typically plays out:
Year 1 & Year 2 — Post-Election (Weak Market Phase)
- After winning, governments focus on passing difficult, often unpopular policies early in their term
- This is when tough fiscal consolidation, tax reforms, or regulatory changes get implemented
- Historically, wars, recessions, and bear markets cluster in the first two years of a presidential term
- Investors face maximum policy uncertainty as the new government’s true economic agenda becomes clear
- Market returns in this phase are below the long-term average
Year 3 & Year 4 — Pre-Election (Strong Market Phase)
- As the next election approaches, incumbent governments shift focus toward economic growth and public approval
- Fiscal stimulus, infrastructure spending, and pro-growth policies are rolled out to boost the economy
- Consumer confidence rises, corporate earnings improve, and market sentiment turns bullish
- This phase historically delivers the strongest market returns of the entire 4-year cycle
The Data Behind the Theory
Data from Western Trust Wealth Management shows that the S&P 500 delivered combined gains of +24.5% in years 3–4 of the presidential cycle versus only +12.5% in years 1–2 (measured across 1950–2023). That’s nearly double the returns simply based on where you are in the election cycle — not which party is in power.
Additionally, BlackRock data shows the S&P 500 has averaged 11.6% annual returns during election years since 1926 — actually slightly above the long-run historical average. This is a crucial insight: despite all the noise, fear, and volatility that surrounds election seasons, elections do not derail bull markets over the long term.
| Election Cycle Year | Avg S&P 500 Performance | Market Mood |
|---|---|---|
| Year 1 (Post-election) | Weakest | Policy adjustment, uncertainty |
| Year 2 (Midterm year) | Below average | Volatility, drawdown risk |
| Year 3 (Pre-election) | Above average | Stimulus, growth focus |
| Year 4 (Election year) | ~11.6% avg (BlackRock) | Moderate, policy bets |
Key Takeaway for Traders: The presidential election cycle theory isn’t a guarantee — but it is a historically consistent pattern that helps explain why market volatility during elections behaves differently at different points in the cycle. Smart traders use this as a macro timing framework, not a trading signal in isolation.
Why does this matter for your portfolio?
If you’re investing during Year 1 or Year 2 of a new government’s term, history suggests you should expect more turbulence and consider defensive positioning. If you’re in Year 3 or Year 4, the historical tailwind from pre-election stimulus and growth spending tends to support a more growth-oriented approach — particularly in election-sensitive sectors like infrastructure, defense, and energy.
This is the foundation of understanding the election cycle effect on stock market returns — and it’s what separates informed, strategic traders from those who react purely to election-day headlines.
Why Elections Impact Markets Like Crazy
When the elections are around, the market can get really unpredictable. As polls shift and candidates clash, we often see big price swings. The uncertainty and guesses of election outcomes lead to increased volatility. In short, elections can really shake up the market, making it a rollercoaster ride for traders!
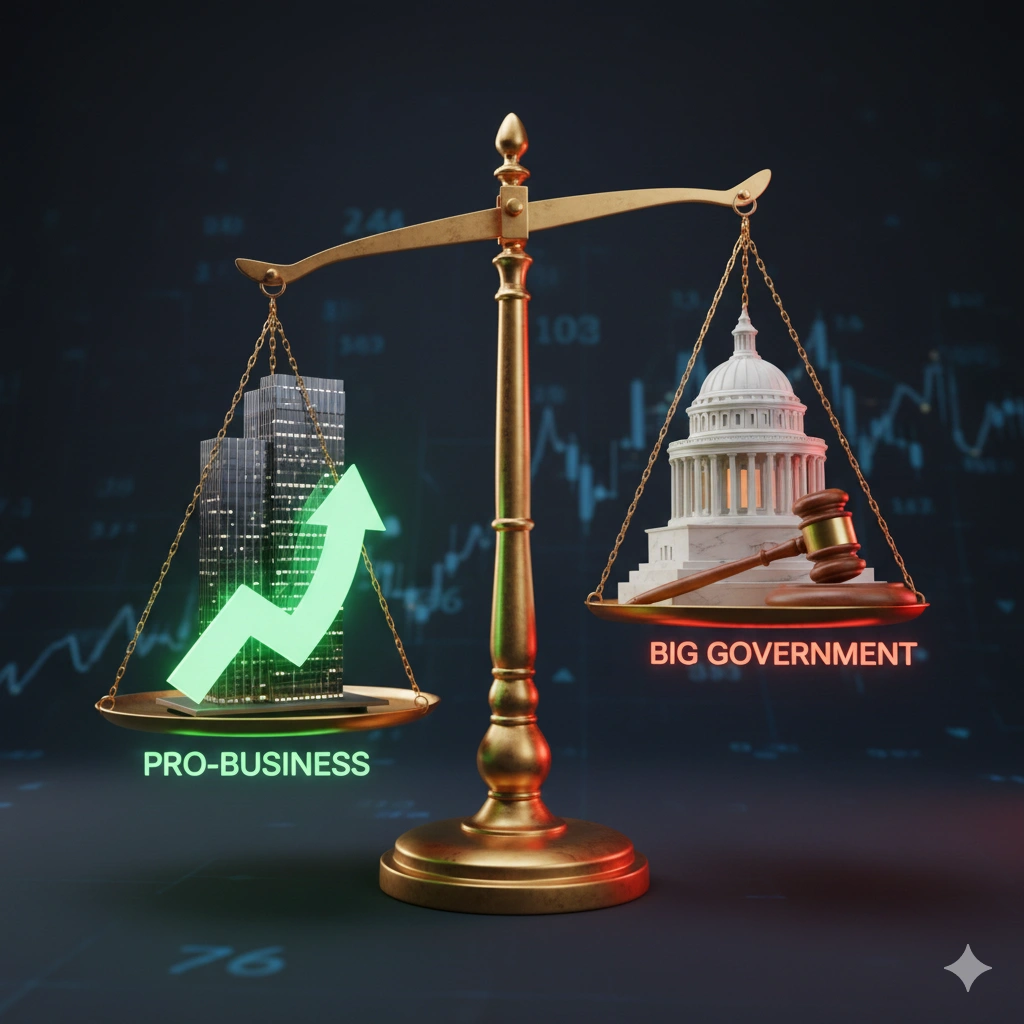
When we look back at historical data, it’s clear that election seasons can really shake up the markets. Often, we see either sharp sell-offs or strong rallies, and it really depends on the type of candidate that wins. A pro-business leader might boost market confidence, while a government focused on tighter regulations or redistribution can cause some caution.
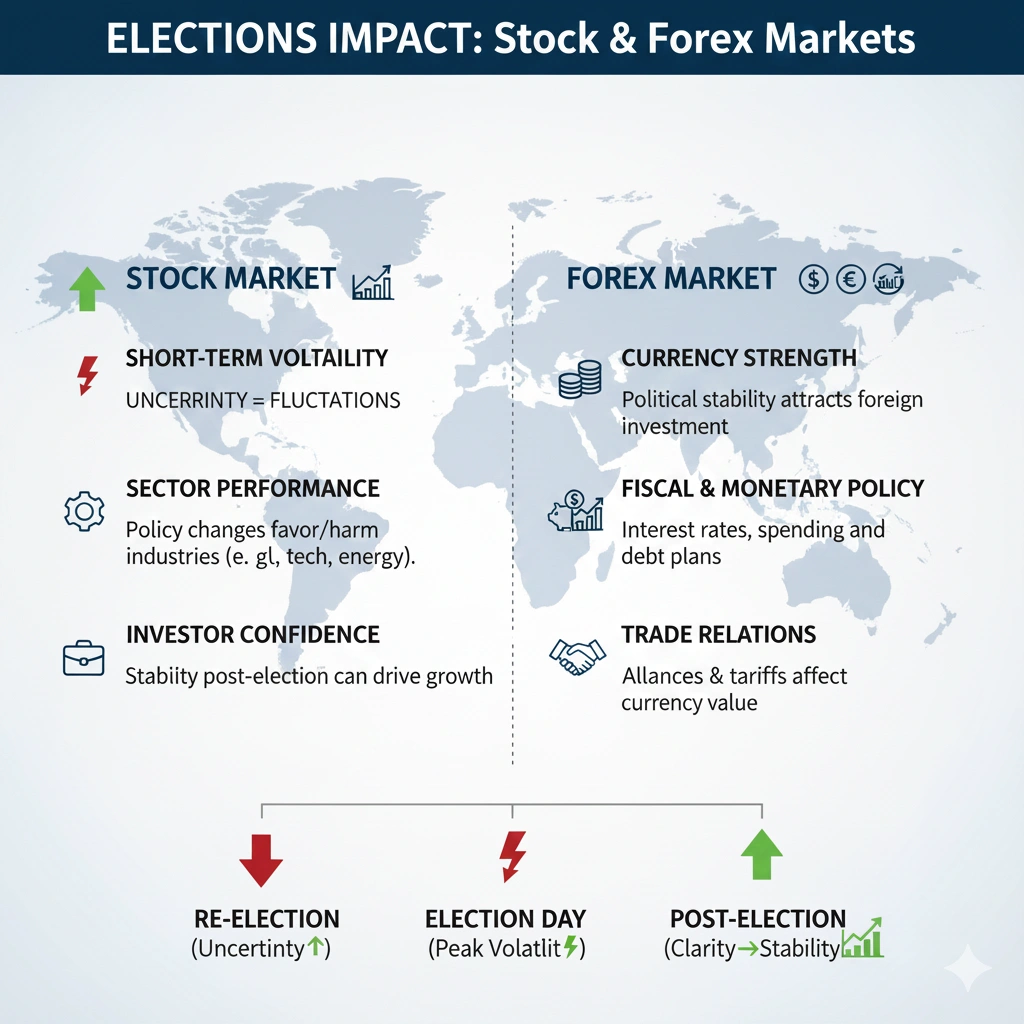
The elections impact markets from before the elections; during this time the markets get jittery. On election day, there’s a lot of chaos, and the prices see ups and downs. But after the results, the market calms down and goes back to focusing on the real fundamentals.
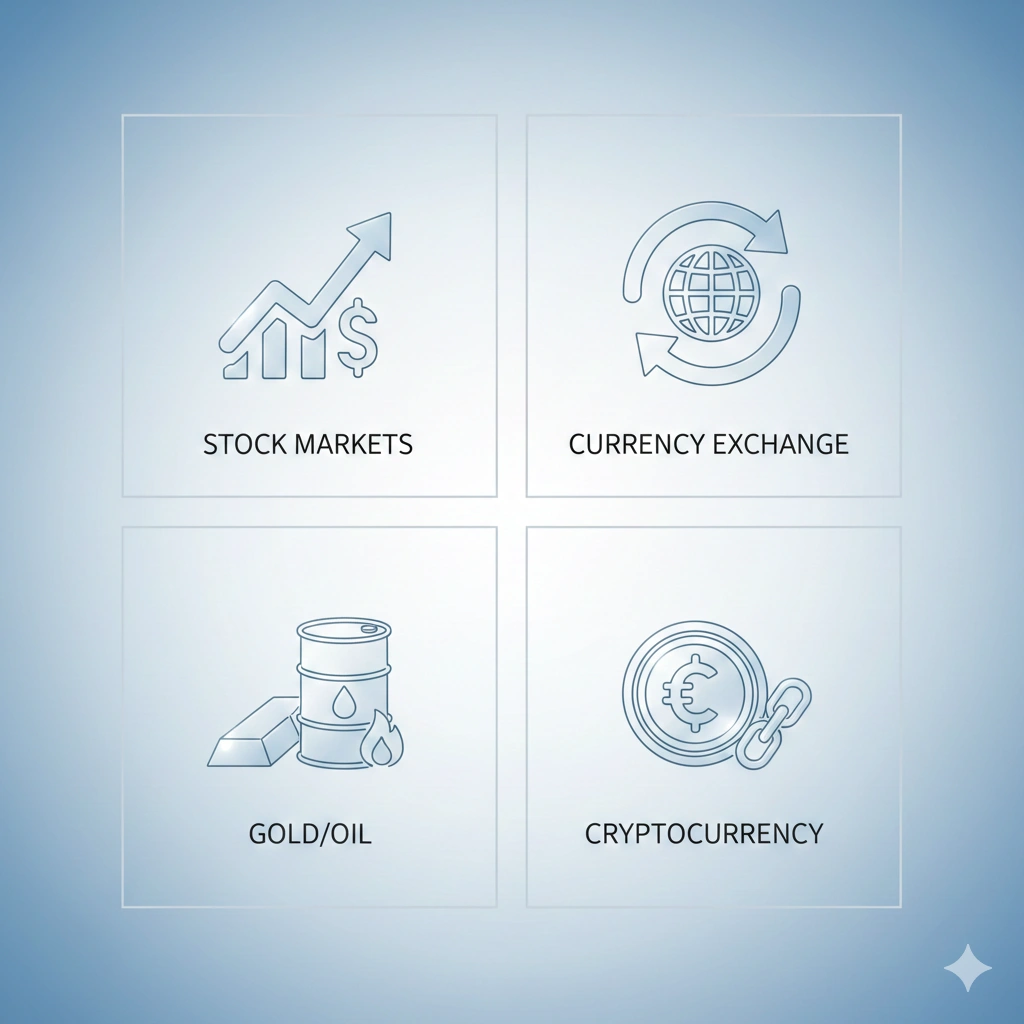
How Elections Hit Different Markets
Let’s get specific. Elections impact markets differently across assets—your forex desk feels it one way, while stock pickers chase sectors.
Equity markets and indices
Broad stock market indices (like the S&P 500, Nifty 50, FTSE, and DAX) typically experience higher volatility during major national elections. This happens because markets try to price in policy uncertainty—investors don’t yet know which regulations, taxes, or spending priorities will prevail.
- During this time, sector rotation becomes very common. You can see the industrial sector getting most of the benefit from a government—such as defense, infrastructure, renewable energy, or healthcare— as they attract more investments, leading to increases in stock prices.
- In past election seasons, the market has experienced both sharp sell-offs and strong rallies. These reactions were based on whether the leading candidate is business-friendly or more focused on wealth redistribution and stricter regulations.
- The market volatility during elections is based on the fact that if the elected party is pro-business, with a mindset to grow the corporate earnings and investment-heavy sectors, but if their main focus is on redistribution and regulations, then it can create short-term caution in high-income or heavily regulated industries.
How Midterm Elections Impact Markets Differently
Most traders obsess over presidential elections — but midterm elections stock market impact is just as powerful, and often more predictable in its pattern.
Midterm elections occur halfway through a presidential term, when all seats in the House and a third of Senate seats are contested. The outcome determines whether the sitting president retains legislative control — and markets price that political risk heavily.
The Hard Numbers
- The S&P 500 has averaged only +1% return during midterm election years since 1957 — far below the long-run average
- Midterm election volatility hits hard mid-year: the average intra-year peak-to-trough drawdown is 17.5% during midterm years
- Yet the post-midterm rally is historically the strongest window of the entire 4-year cycle — the S&P 500 averages +14% in the 6 months following midterms (November–April) according to Carson Research
| Midterm Market Phase | What Happens |
|---|---|
| Pre-midterm (Jan–Oct) | High volatility, average +1% return, 17.5% drawdown |
| Post-midterm (Nov–Apr) | Strongest 6-month window of 4-year cycle, avg +14% |
Why does this pattern repeat?
Congressional elections and market returns are linked through gridlock logic — markets actually prefer a divided government because it limits the chance of extreme policy swings in either direction. Once midterm results confirm legislative balance, uncertainty clears rapidly, triggering the sharp post-midterm rally.
Trader Insight: The midterm drawdown is the opportunity — not the threat. Historically, investors who bought the midterm dip were rewarded with above-average returns in the following two quarters.
Forex markets and currency pairs
Election outcomes strongly influence currency markets because they shape expectations for:
- Interest rates (via fiscal policy direction)
- Government borrowing and deficits
- Trade policy and geopolitical stability
These macro factors directly impact both major FX pairs (like EUR/USD and USD/JPY) and emerging-market currencies.
Examples:
- US presidential elections frequently create major moves in USD pairs due to changes in Fed policy, tariffs, and fiscal spending.
- India (INR) tends to react to election outcomes that may affect capital flows, reforms, and government spending.
- Mexico (MXN) gets highly impacted by US election outcomes because their trade policies—especially around NAFTA/USMCA—affect its economy.
- UK elections (GBP) have historically moved the pound based on expectations around Brexit, fiscal programs, and monetary independence.
Commodities and safe-haven assets
During election time you might have seen a shift toward safe-haven assets such as gold, silver, US Treasuries, and the Japanese yen. Because of high uncertainty, you’ll often see this shift as traders try to reduce risk.
- Gold is most preferred during elections because it’s viewed as a stable store of value.
- At the time of election campaigns, you often see more growth in commodities like copper and industrial metals because of new infrastructure projects, stimulus plans and large public investments.
- Energy markets (oil and gas) reacts very quickly to the winning party’s view on:
- drilling approvals
- environmental regulations
- subsidies and taxation
- strategic reserves
These factors directly influence supply projections and price expectations.
Cryptocurrencies and digital assets
Crypto markets can behave in two ways during political events:
- As risk assets, falling or rising with overall investor sentiment during periods of uncertainty or relief.
- The government policies related to regulation, taxation, stablecoins, exchange licensing, and CBDC development have strong influence on asset price.
- News related to crypto regulation, enforcement, investor protections, or adoption by the parties or candidates highlight leads to volatility in digital assets.
- A spike in the trading volume and short-term volatility is very common in Bitcoin, Ethereum, and even altcoins, during major announcements like election results, regulatory proposals, or central bank digital currency plans are made.
Historical Data On How Elections Impact Markets
Elections can shake the market rapidly, but in the long run the stock market tends to rise no matter who wins. For example, after the 2024 United States presidential election, the S&P 500 jumped immediately as investors cheered reduced uncertainty and a clearer policy outlook. And how in India, even though the 2024 Indian general election results were on the good side, it still caused a sharp drop in Sensex and Nifty 50, but within days the investors’ focus shifted back to fundamentals like company earnings and economic prospects.
The takeaway? Election-driven volatility can dominate the market for a short period— but in the medium to long term, fundamentals like earnings, economic growth, and investor sentiment tend to drive gains.
| Election Type | Avg Pre-Election Drawdown | Avg Post-Election Return (6 months) | Key Market Driver |
|---|---|---|---|
| Presidential (incumbent wins) | Moderate | ~6.5% S&P gain | Policy continuity |
| Presidential (party change) | Higher | ~5% S&P gain | New policy bets |
| Midterm elections | High (~17.5% drawdown) | +14% post-result | Uncertainty cleared |
| Emerging market elections (India, Brazil) | Very High | Volatile, fundamentals-led | Reform expectations |
How Elections Impact Indian Markets (Nifty & Sensex)
India’s elections are among the most market-moving political events globally — and for traders in the Indian market, understanding this pattern is critical.
- Nifty 50 and Sensex typically see elevated pre-election volatility as coalition outcome uncertainty rises
- A surprise result — even a positive one — can trigger a sharp intraday circuit breaker level move
- INR (Indian Rupee) weakens during election uncertainty as FIIs reduce emerging market exposure
- Post-result, if a stable majority government is confirmed, Indian markets historically recover within 5–10 trading sessions
- FII inflows are the key metric to watch — foreign institutional investors drive large directional moves in Nifty during election periods
Which Sectors Benefit Most When Elections Impact Markets?
Sector rotation during elections is one of the most reliable patterns in political investing. When a new government takes power, money doesn’t leave the market — it moves within it, rotating toward sectors aligned with the winning party’s policy agenda.
Understanding election-driven sector performance helps traders position ahead of the crowd rather than react after the move has already happened.
| Winning Party Policy Focus | Beneficiary Sectors | Sectors to Watch |
|---|---|---|
| Infrastructure & stimulus | Defense stocks, construction, metals | Tech, pharma |
| Pro-fossil fuel | Oil & gas, pipelines | Renewable energy |
| Green energy & climate | Solar, EV, clean tech | Traditional energy |
| Deregulation | Banks, financials | Healthcare |
| Higher corporate taxes | Bonds, utilities | High-growth tech |
Key patterns to know:
- Defense stocks and elections move together — any government increasing military or border spending immediately lifts defense contractors and aerospace stocks
- Energy sector election impact is the most volatile rotation — a single policy shift on drilling approvals or carbon tax can swing energy stocks 10–15% within days of results
- Financials surge under deregulation bets; utilities become safe havens under high-tax, low-growth policy expectations
Trader Tip: Don’t wait for results. Sector rotation begins during polling — watch money flow into beneficiary sectors 2–3 weeks before election day as a leading signal.
Trading Strategies Amid Election Volatility
Here’s where many traders go wrong: they ignore position size, especially when the market is unpredictable. It is important to stay cautious during the elections. Use options (like protective puts or straddles) instead of heavy futures to manage risk. Pay attention to the sector rotation because the change in policies can shift the opportunities toward specific industries both in India and around the world.
In forex trading, you can expect bigger moves in pairs like USD/INR, GBP/USD, and USD/JPY; avoid large trades. Balance your equity positions by including gold or other safe assets in your portfolio. For crypto, reduce leverage because regulatory comments can trigger sharp swings. Finally, wait for post-result stability before taking strong directional trades.
Manage your risk effectively; don’t let emotions or FOMO take over your trades because that could lead to big losses. Use proper stop-loss levels and exit if no breakout in 6 hours. Remember, the market volatility usually fades within 1-2 weeks after elections.
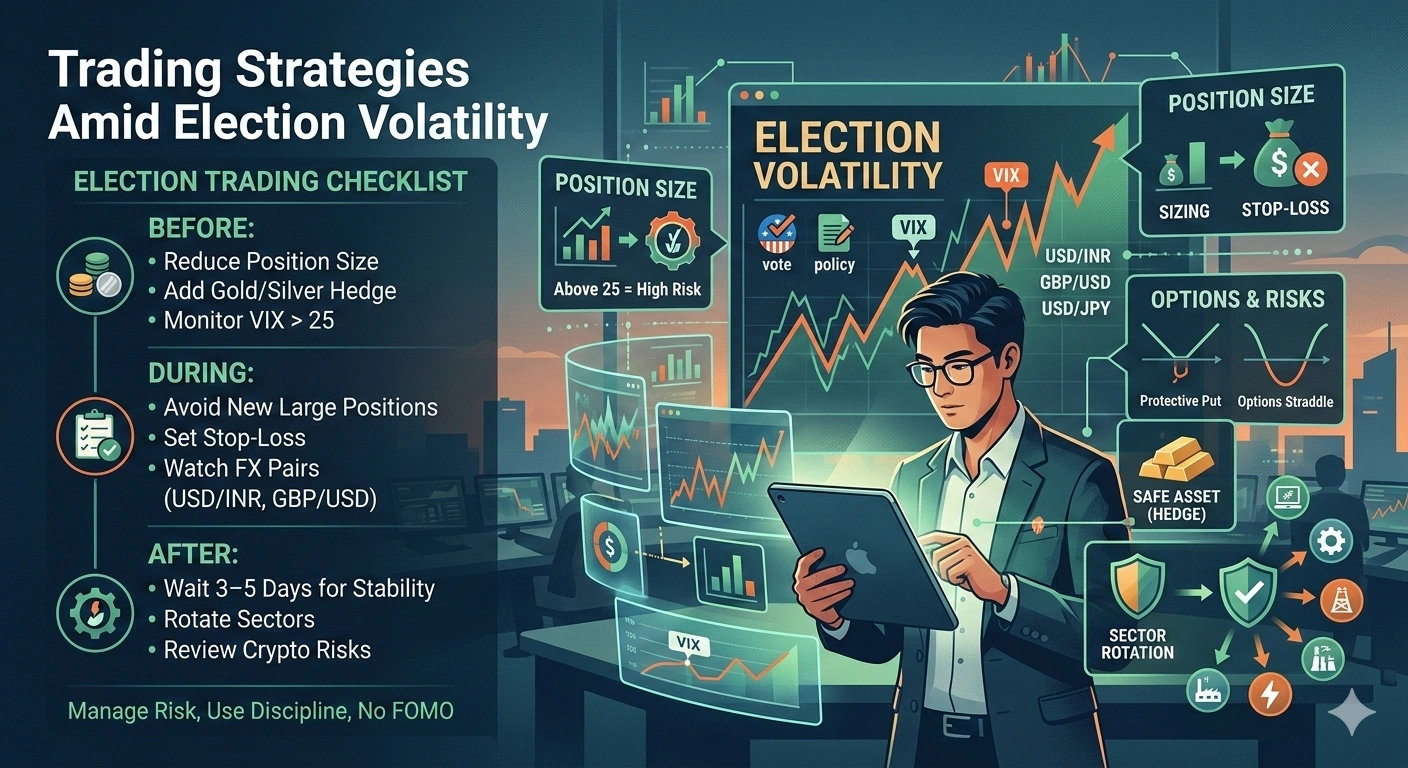
Election Trading Checklist: What to Do Before, During & After
No election trading strategy works without discipline. Here’s your phase-by-phase action plan:
Before the Election (4–6 Weeks Out)
This is your preparation window. How to trade election volatility starts with reducing exposure before it peaks — not after.
- Reduce position size on high-beta stocks
- Add gold or silver as a safe-haven hedge
- Monitor VIX and election risk — a VIX reading above 25 signals elevated market stress; consider defensive repositioning
- Use options straddles to profit from sharp moves in either direction without committing to a direction
On Election Day
- Avoid entering new large positions — prices can gap unpredictably on early result signals
- Set stop-loss during elections on all open trades before markets open
- Watch USD/INR, GBP/USD, and USD/JPY pairs closely — currency markets often move before equity markets on election night
After Results (1–2 Weeks)
- Apply your post-election market strategy only after initial volatility settles — typically 3–5 trading days post-result
- Rotate into sectors aligned with the winning party’s policy agenda
- Review crypto and digital asset positions for any regulatory risk signals from the new government
The biggest mistake traders make is acting on election-day emotion. The checklist above keeps your decisions process-driven, not news-driven.
FAQs: Elections Impact Markets
1. Do elections always impact market conditions?
Yes, but the intensity varies. Every major election introduces policy uncertainty, which drives short-term market volatility during elections across stocks, currencies, and commodities. The impact is strongest in the 2–4 weeks before and after results. Long-term, markets tend to recover and refocus on fundamentals like earnings and economic growth within 1–2 months.
2. Why do stock markets react to elections?
Markets react because elections signal potential changes in corporate tax rates, government spending, trade policy, and regulatory frameworks — all of which directly affect company profits and investor sentiment. The bigger the expected policy shift, the sharper the market reaction. This is why a surprise result always triggers more volatility than a widely expected outcome.
3. How do elections affect forex markets?
Election impact on currency markets works through three channels — changes in expected interest rate policy, shifts in fiscal deficits, and new trade agreements or tariffs. Major pairs like EUR/USD, GBP/USD, and USD/JPY move on US election outcomes, while emerging market currencies like INR and MXN are highly sensitive to both domestic elections and US presidential results due to their trade and capital flow dependencies.
4. Which sectors are most impacted during elections?
Sector rotation during elections consistently favors industries directly tied to government spending. Defense, infrastructure, energy, and banking see the strongest price movements as traders bet on policy-beneficiary sectors. The key is identifying which sectors align with the winning party’s agenda before results are confirmed — that’s where the majority of the move happens.
5. Are emerging markets more sensitive to elections?
Yes — significantly more. Countries like India, Mexico, and Brazil carry higher political risk premium, meaning their equity and currency markets react faster and more sharply to election outcomes. This is because emerging markets are more dependent on foreign capital flows, which are highly sensitive to political stability, reform expectations, and government spending direction.
6. What is the Presidential Election Cycle Theory?
The Presidential Election Cycle Theory states that stock markets follow a predictable 4-year pattern tied to election cycles. Years 1–2 post-election deliver below-average returns as governments implement tough policies. Years 3–4 deliver above-average returns as pre-election stimulus kicks in. Data shows the S&P 500 averages +24.5% in years 3–4 versus only +12.5% in years 1–2 — making cycle positioning a valuable macro timing tool.
7. Do midterm elections impact the stock market?
Yes. Midterm election volatility is often underestimated. The S&P 500 averages only +1% return during midterm years with an average intra-year drawdown of 17.5%. However, the post-midterm rally that follows is historically the strongest 6-month window of the entire 4-year cycle, averaging +14% returns — making the midterm dip a historically reliable buying opportunity.
8. How should I protect my portfolio during elections?
A sound election trading strategy includes reducing exposure to high-beta stocks 4–6 weeks before results, adding safe-haven assets like gold or silver, monitoring VIX and election risk levels, and using options to hedge directional uncertainty. After results, wait 3–5 trading days for volatility to settle before rotating into policy-beneficiary sectors.
Conclusion
Elections impact markets in ways that are noisy short-term but highly patterned long-term. The traders who profit aren’t the ones glued to election night coverage — they’re the ones who understood sector rotation weeks earlier, hedged with safe-haven assets, and had a checklist ready before the first vote was cast. Use this guide as your framework every election season — and visit InsightfulTrade for real-time market analysis and election-driven strategy updates.
Author: Kumkum Chandak
Experience: 3+ Years in Trading Research & Market Content Strategy
Kumkum Chandak is a trading content strategist and market research writer who specializes in simplifying technical analysis, trading tools, and strategy-driven educational content. Her work is optimized for EEAT, accuracy, and user intent, ensuring every article delivers practical insights for traders of all levels.
Risk Disclaimer:
All content is strictly educational and not financial advice. Trading involves substantial risk. Always perform your own analysis or consult a professional advisor.
Last Updated: 2 March 2026