Introduction
The double top strategy is one of the most trusted methods used by forex traders to identify potential market reversals. Among all chart patterns, the double top and double bottom formations stand out because they are simple to recognize, reliable when confirmed, and effective across different timeframes. Whether you are a beginner or an experienced trader, learning these patterns can significantly improve your technical analysis skills and help you find higher-probability forex entries.
Markets constantly move between trends and corrections. During strong trends, many traders wonder when the market will reverse. Instead of guessing, professional traders rely on price action and proven chart patterns. The double top pattern signals that buyers are losing control after an uptrend, while the double bottom pattern suggests that sellers are running out of momentum after a downtrend. When combined with volume, support and resistance, and proper risk management, these patterns become powerful tools for reversal trading.
This guide explains everything you need to know about the double top strategy, including how the patterns form, how to identify them, confirmation techniques, entry methods, stop-loss placement, profit targets, common mistakes, and practical trading tips.
Chart Patterns: Mastering the Double Top and Double Bottom Strategy
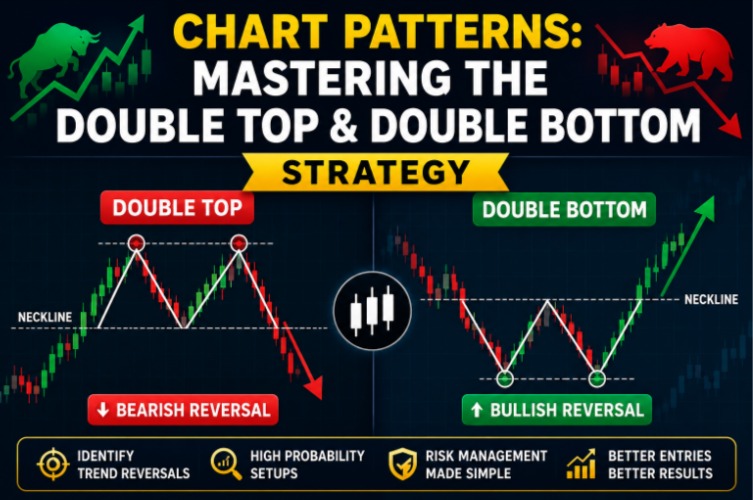
Chart patterns are one of the most valuable tools in technical analysis because they help traders identify potential trend reversals and continuation opportunities. Among the most reliable reversal chart patterns are the Double Top and Double Bottom. These formations are widely used in forex trading to identify high-probability trading opportunities and improve forex entries.
A Double Top is a bearish reversal chart pattern that forms after a strong uptrend. It resembles the letter “M” and develops when price reaches a resistance level twice but fails to break above it. The first peak shows strong buying pressure, while the second peak indicates buyers are losing momentum. Once the price breaks below the neckline, the pattern is confirmed, signaling that sellers have taken control. Traders often use this confirmation to enter short positions, placing a stop-loss above the second peak and targeting a price move equal to the height of the pattern.
These chart patterns work because they reflect changing market psychology. In a double top, buyers attempt to push prices higher but fail, leading to increased selling pressure. In a double bottom, sellers lose control as buyers step in at support, causing the market to reverse upward. This shift in supply and demand makes these formations effective tools for reversal trading.
For better trading results, the Double Top and Double Bottom Strategy should be combined with technical analysis tools such as support and resistance, trendlines, moving averages, RSI divergence, and MACD confirmation. Waiting for the neckline breakout before entering a trade significantly reduces false signals and improves the quality of forex entries.
Reversal Trading: Identifying Trend Changes with the Double Top and Double Bottom Strategy
Reversal trading is a trading approach that focuses on identifying the point where an existing market trend is likely to change direction. Instead of following the current trend, reversal traders look for signs that buying or selling momentum is weakening and prepare to trade in the opposite direction. In the forex market, this strategy is highly popular because major trend reversals often create strong price movements and excellent trading opportunities. One of the most effective ways to identify these turning points is by using the Double Top and Double Bottom chart patterns.
A Double Top signals a potential bearish reversal after a sustained uptrend. The pattern forms when price reaches a resistance level, pulls back, and then attempts another rally but fails to break above the previous high. This failure indicates that buyers are losing strength while sellers are beginning to take control. The reversal is confirmed when the price breaks below the neckline, providing traders with a clear signal to consider a sell trade. Conversely, a Double Bottom indicates a bullish reversal after a prolonged downtrend.
It develops when price tests the same support level twice without creating a new low, suggesting that selling pressure is fading. Once the price breaks above the neckline, the pattern confirms a bullish reversal and presents a potential buying opportunity.
The Double Top and Double Bottom Strategy remains one of the most trusted methods for reversal trading because it is based on market psychology and price action rather than prediction. By recognizing when buyers or sellers are losing momentum, traders can identify potential trend changes with greater confidence. When combined with disciplined risk management and solid technical analysis, these reversal patterns provide reliable opportunities to capture profitable moves in the forex market.
Technical Analysis: Improving the Double Top and Double Bottom Strategy
Technical analysis is the foundation of successful forex trading because it helps traders make decisions based on historical price movements, market trends, and chart patterns rather than emotions or guesswork. When trading the Double Top and Double Bottom Strategy, technical analysis provides additional confirmation that increases the probability of successful trades. By combining these reversal chart patterns with technical indicators and price action, traders can identify stronger forex entries and avoid many false signals.
One of the most important aspects of technical analysis is identifying support and resistance levels. A Double Top becomes more reliable when it forms near a strong resistance zone, while a Double Bottom is more effective when it develops at a well-established support level. These key price levels represent areas where buyers and sellers have previously taken control, making them ideal locations for potential trend reversals.
Successful technical analysis is not about relying on a single indicator but about combining multiple forms of confirmation. Traders who use support and resistance, trendlines, moving averages, RSI, MACD, and candlestick confirmation alongside the Double Top and Double Bottom Strategy are better equipped to identify genuine market reversals. This comprehensive approach reduces false breakouts, improves forex entries, and increases overall trading consistency. By mastering technical analysis, traders can make more informed decisions and build greater confidence in their reversal trading strategy.
Forex Entries: Finding High-Probability Trades with the Double Top and Double Bottom Strategy
Successful forex entries are the foundation of consistent trading profits, and the Double Top and Double Bottom Strategy provides traders with a structured approach to entering the market at potential trend reversal points. Rather than entering trades based on emotion or speculation, these classic chart patterns allow traders to wait for confirmation before opening a position. This disciplined approach helps reduce false signals and improves overall trading performance.
For a Double Top, the best forex entry occurs only after the price breaks below the neckline, confirming that the previous uptrend has lost momentum. Entering before the neckline breakout increases the risk of being caught in a false reversal if buyers regain control. Many experienced traders wait for the price to retest the broken neckline as a new resistance level before placing a sell order. This confirmation often provides a more favorable entry price and allows for a tighter stop-loss, improving the trade’s risk-to-reward ratio.
Risk management is equally important when planning forex entries. For a Double Top trade, the stop-loss is typically placed just above the second peak, while for a Double Bottom trade, it is positioned below the second low. Profit targets are often determined by measuring the height of the pattern and projecting that distance from the neckline breakout. Maintaining a minimum risk-to-reward ratio of 1:2 ensures that profitable trades outweigh losing ones over time.
Conclusion
The Double Top and Double Bottom Strategy is one of the most reliable approaches for identifying trend reversals in the forex market. These classic chart patterns help traders recognize when buying or selling momentum is weakening, allowing them to prepare for potential changes in market direction. By waiting for neckline confirmation instead of predicting reversals, traders can reduce false signals and improve the quality of their trading decisions.
Combining the double top strategy with effective technical analysis tools such as support and resistance, trendlines, moving averages, RSI, MACD, and candlestick confirmation further increases the probability of successful reversal trading. Equally important is selecting disciplined forex entries, placing logical stop-loss orders, and maintaining a favorable risk-to-reward ratio. These practices help protect trading capital while maximizing long-term profitability.
Although no trading strategy guarantees success, consistent application of the Double Top and Double Bottom Strategy, combined with patience, proper risk management, and continuous learning, can significantly improve trading performance. Whether you are a beginner learning price action or an experienced trader refining your approach, mastering these reversal chart patterns will help you identify higher-probability opportunities and build greater confidence in the forex market. By following a well-defined trading plan and remaining disciplined, you can use the Double Top and Double Bottom Strategy as a valuable part of your long-term forex trading success.