Have you ever stared at a stock chart and thought, “What’s going on?” Candlestick patterns are essential to interpret price movements and trends. Whether you are a novice or seasoned trader, understanding candlestick chart patterns can improve your trading performance. Here, we’ll cover the key candlestick patterns that every trader should know and provide you with easy-to-understand insights and tips to trade better.
Key takeaway
- Candlestick patterns provide a way to interpret market sentiment or to get a read on how buyers and sellers are thinking.
- Primary candlestick patterns are best used in conjunction with trend, volume, and support and resistance levels.
- No candlestick chart patterns are 100% accurate—they are probabilistic.
- It’s better to focus on a handful of patterns than to memorize all candlestick patterns.
What Are Candlestick Patterns?
Candlesticks date back to 18th-century Japan, when they were used to read price action and market sentiment. The candles represent the open, high, low, and close prices over a specific time frame.
A green or white candle indicates a higher close (bullish), and a red or black candle indicates a lower close (bearish). Bodies and wicks provide clues to traders in the form of price action, which can be interpreted in multiple candlestick chart patterns.
Types of Candlestick Patterns
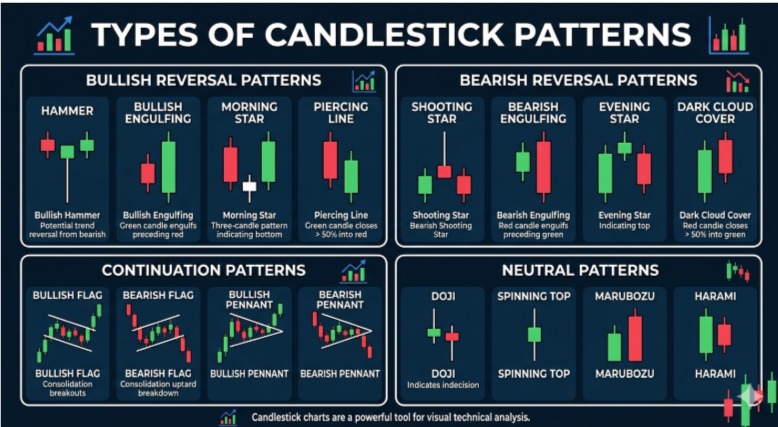
Candlestick patterns can be broadly classified as single patterns or multiple patterns, offering different interpretations of price action. These candlestick patterns give us clues about the short-term sentiment and trend changes.
Single Candlestick Patterns
Single candlesticks reflect short-term sentiment and the price action in one candlestick. They can be used to identify short-term changes in supply and demand.
- Hammer: Bullish, rejection of lower prices after a downtrend
- Doji: A sign of indecision, as the open and close prices are around the same
- Shooting Star: A bearish pattern, indicating a rejection of higher prices
Multiple Candlestick Patterns
Notable patterns based on multiple candlesticks visualize trends and reversals of multiple bars.
- Engulfing: A powerful reversal pattern with one candle completely consuming the other
- Morning Star: A strong reversal pattern indicating a change in trend from down to up
- Evening Star: A bearish reversal pattern, a weakening of upward momentum
- Three White Soldiers: Indicates strong buying pressure
- Three Black Crows: Shows strong and consistent selling pressure
These primary candlestick patterns are popular among traders to determine buy/sell signals, trend direction, and momentum.
How to Use Candlestick Patterns in Trading
Candlestick patterns can be used to identify opportunities and make trading decisions. These candlestick chart patterns make trading simpler in volatile markets
- Assess the chart: Look at trend, support, and resistance, and price action
- Identify patterns: Recognise popular formations such as hammer, doji, engulfing
- Analyze sentiment: Candle body, size, and wicks represent activity
- Plan trades: Use signals for buy or sell
- Validate and confirm: Use RSI, moving averages, or volume
Major candlestick patterns with confirmation lead to a more accurate and lower-risk trading strategy.
Benefits and limitations of candlestick analysis
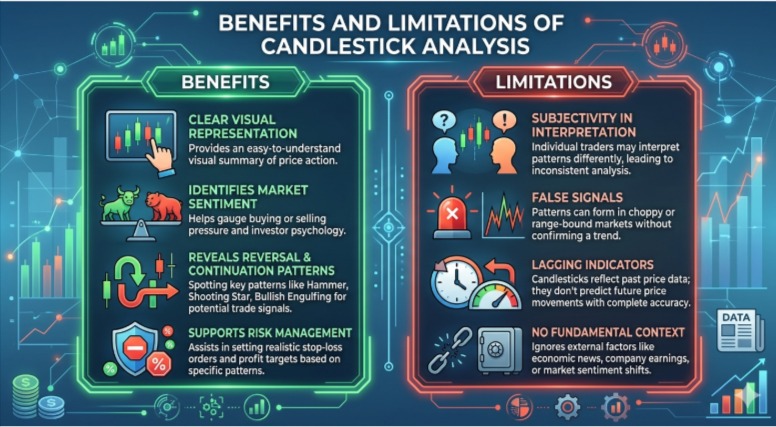
Benefits of candlestick analysis
- Easy to spot visually: Candlestick patterns are an easy, visual, and efficient way to interpret the market.
- Recognized patterns: Investors can easily recognise potential reversals and continuations in the form of a hammer or doji to take timely action.
- Simplicity: The simplicity of candlestick charts makes them easy for beginner traders to learn and understand.
- More insights: Candlesticks include the open, high, low, and close prices, which can help investors recognise the interactions of buying and selling in a market.
Limitations of candlestick analysis
- Risk of false positives: Candlestick patterns may not be completely accurate in volatile or range-bound markets.
- Historical nature: Candlestick patterns are a reaction to past price movements and can be unreliable for future predictions.
- Time frame dependence: Candlestick patterns may differ across various time frames.
- Confirmation: Candlestick patterns aren’t 100% accurate, especially when used alone, so make sure to look at other indicators as well.
How to Use Candlestick Patterns Effectively
Knowing the patterns is step one. Knowing how to use them is the next step. Here are the three factors professional traders combine with candlesticks:
- 1. Direction of trend: Reversal patterns make sense (if at all) only in a trend.
- Support and resistance levels: A hammer at a random price point is noise. A hammer at a support is important.
- Volume confirmation: High volume on a reversal candle greatly enhances the reliability of all candlestick patterns.
- Time frame: A bearish engulfing pattern on the 5-minute time frame is not as important as a daily bearish engulfing.
- Proper risk management: Always set a stop-loss before trading a pattern. Even the best setups don’t pan out every time.
Conclusion
The candlestick patterns in this guide (from the simple Doji to the more complex Three White Soldiers) are the most common and best-tested technical analysis signals. They’re not magic. They’re not going to make you rich. But they will help you understand what’s happening in the market.
Learn all about candlestick patterns with InsightfulTrade, expert analysis, and practical tips, and trade with the best candlestick chart patterns for success now.
FAQs
1: Are candlestick patterns reliable for trading?
Candlestick patterns can work in conjunction with volume, trend, and support/resistance. But they aren’t 100% reliable and should be applied in conjunction with other analyses and risk-reward management.
2: What is the most powerful candlestick pattern?
Engulfing and Morning/Evening Star patterns are considered the most powerful candlestick chart patterns by many traders, particularly when they develop just at support or resistance levels with volume support.
3: Can candlestick patterns be used in all markets?
Yes, candlestick patterns work on all liquid markets like stocks, forex, commodities, crypto, and indices because they show universal market psychology, which is based on volume and price.
4: How many candlestick patterns are there?
There are more than 100 patterns, but most traders use a handful of key candlestick patterns that are most common and give better trading signals in the real market.
5: Which timeframe is best for candlestick patterns?
Candlestick patterns can be used across any time frame, but higher time frames (such as daily and weekly) are more effective as they contain more data and filter out market noise.
Author: Arihant Jain
Trading Experience: 5+ Years
Arihant Jain is a financial markets analyst and trading educator with expertise in Forex, indices, crypto, and risk-managed trading systems. His insights are based on real trading experience, data-driven analysis, and transparent market understanding. All content is reviewed for accuracy and aligns with Google’s EEAT guidelines.
Risk Disclaimer:
Trading involves substantial risk. All information is for educational purposes only and should not be taken as financial advice. Always do your own research.