The US30 index, also known as the Dow Jones Industrial Average (DJIA), is one of the oldest and most closely watched stock market indices in the world. Created by Charles Dow in 1896, it tracks 30 blue-chip companies across sectors including technology, healthcare, financials, and industrials listed on the New York Stock Exchange (NYSE) and NASDAQ.
Unlike the S&P 500, which is market-cap weighted, the US30 is a price-weighted index — meaning companies with higher stock prices have a greater influence on the index’s movement regardless of their overall market size. This makes understanding US30 market drivers even more critical, because a single high-priced stock like UnitedHealth Group or Goldman Sachs can move the entire index.
In this guide, you’ll learn exactly what factors drive US30 price movements, how each indicator works, and what traders watch in real time to anticipate where the Dow Jones is headed next.

What Is US30, and How Is It Calculated?
The US30 is a price-weighted stock market index that measures the collective performance of 30 large-cap American companies. The index value is calculated by adding the stock prices of all 30 constituent companies and dividing the total by the Dow Divisor — a constantly adjusted figure that accounts for stock splits, dividends, and component changes.
Because it is price-weighted rather than market-cap weighted, a $400 stock will influence the index far more than a $50 stock, even if the cheaper company is actually worth more overall. This is a key distinction traders must understand.
Current US30 components include well-known companies such as Apple (AAPL), Microsoft (MSFT), Goldman Sachs (GS), Boeing (BA), Walmart (WMT), Coca-Cola (KO), Caterpillar (CAT), Johnson & Johnson (JNJ), and Amazon (AMZN).
The index trades under the ticker $DJIA and its CFD equivalent US30 is available on most forex and CFD trading platforms nearly 24 hours a day, 5 days a week during futures market hours.
US30: Why It Matters to Global Traders
The US30 serves as a real-time barometer of US economic health and investor sentiment. Because its 30 components span major sectors — from financials and technology to healthcare and industrials — a sustained rise in the Dow Jones signals broad market confidence, while a sharp decline often reflects recession fears or geopolitical uncertainty. For global traders, the US30 also acts as a leading indicator for other indices, meaning movements in the Dow Jones often set the tone for European and Asian markets the following session.
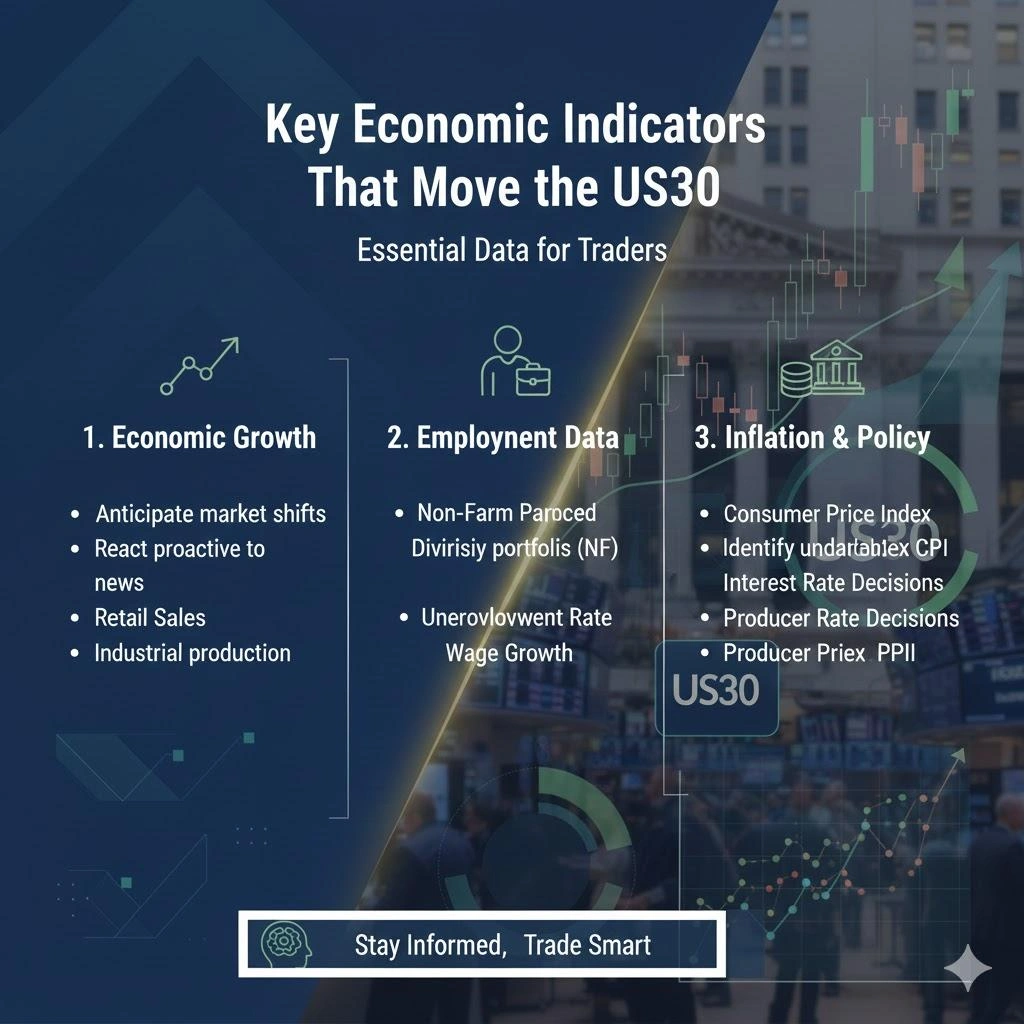
Key Economic Indicators That Move the US30
Below are the most important indicators that consistently influence the direction of the US30 index.
a. GDP Growth – The Backbone of Market Confidence
The fact that Gross Domestic Product (GDP) directly reflects the economy of a country. A strong GDP will typically boost corporate revenue prospects.
Impact on US30:
- Strong GDP means higher investor confidence, leading to rise in US30.
- Weak GDP means recession concerns leading to US30 declines
Traders monitor quarterly GDP growth because the Dow’s components are sensitive to future demand expectations.
b. Inflation Data – CPI & PCE Move the Dow
The Federal Reserve uses inflation rates to determine its interest rate choices. The central bank raises interest rates when inflation reaches high levels, but they lower interest rates when inflation shows signs of slowing down.
Impact on US30:
- High inflation → Fed tightening → pressure on equities → US30 falls
- Low/moderate inflation → potential rate cuts → US30 gains
Indices like CPI (Consumer Price Index) and PCE (Personal Consumption Expenditures) act as leading indicators for market direction.
c. Federal Reserve Interest Rate Decisions
The Federal Reserve stands as the most influential element that determines US30 market performance. The way people view interest rates determines how much it costs to borrow money, how well businesses perform, and how cautious investors should be.
Impact on US30:
- Rate hikes → reduced liquidity → bearish US30
- Rate cuts → increased liquidity → bullish US30
Traders follow FOMC statements, dot plots, and Fed speeches for clues.
The Federal Reserve entered 2026 with the federal funds rate held at 4.25%–4.50%, following a cautious pause after rate cuts in late 2024. Markets in early 2026 are closely watching Fed Chair Jerome Powell’s guidance on whether rate cuts will resume in 2026, with every FOMC statement triggering notable US30 volatility.
d. Labor Market Data – NFP and Unemployment Rate
The US30 reacts strongly to labor market numbers, especially the Non-Farm Payrolls (NFP) report.
Strong jobs data:
- Signals economic strength
- Encourages corporate spending
- Boosts consumer demand
→ Supports US30 upside unless it sparks inflation fears
Weak jobs data:
- Raises recession concerns
- Reduces earnings expectations
→ Dow often declines
Employment trends provide some of the clearest signals of the economy’s health.
As of early 2026, the US labor market remains a central focus for Dow Jones traders. Monthly NFP releases continue to be the single biggest scheduled volatility event for US30 CFD traders, with surprises in either direction causing sharp intraday swings in the index.
e. Consumer Confidence Index (CCI)
Since consumer spending makes up roughly 70% of US GDP, sentiment indicators have enormous influence.
- High consumer confidence → more spending → bullish US30
- Low confidence → reduced demand → bearish US30
Retail-heavy Dow components like Walmart, Home Depot, and Disney are particularly sensitive.
f. Manufacturing Data – PMI & ISM Reports
PMI and ISM manufacturing indices signal economic expansion or contraction.
- Above 50: Expansion → positive for US30
- Below 50: Contraction → potential Dow weakness
Industrials within the Dow—such as Caterpillar and Boeing—react strongly to supply chain and factory activity data.
g. Corporate Earnings – The Most Direct Market Driver
The US30 experiences extreme market fluctuations during earnings reporting season. The market sentiment depends mainly on the financial results of large-cap companies, which make up the index.
- Better-than-expected earnings → US30 rallies
- Earnings misses → US30 drops
Tech giants and financial leaders often lead these movements.
US30 Trading Hours: When Can You Trade the Dow?
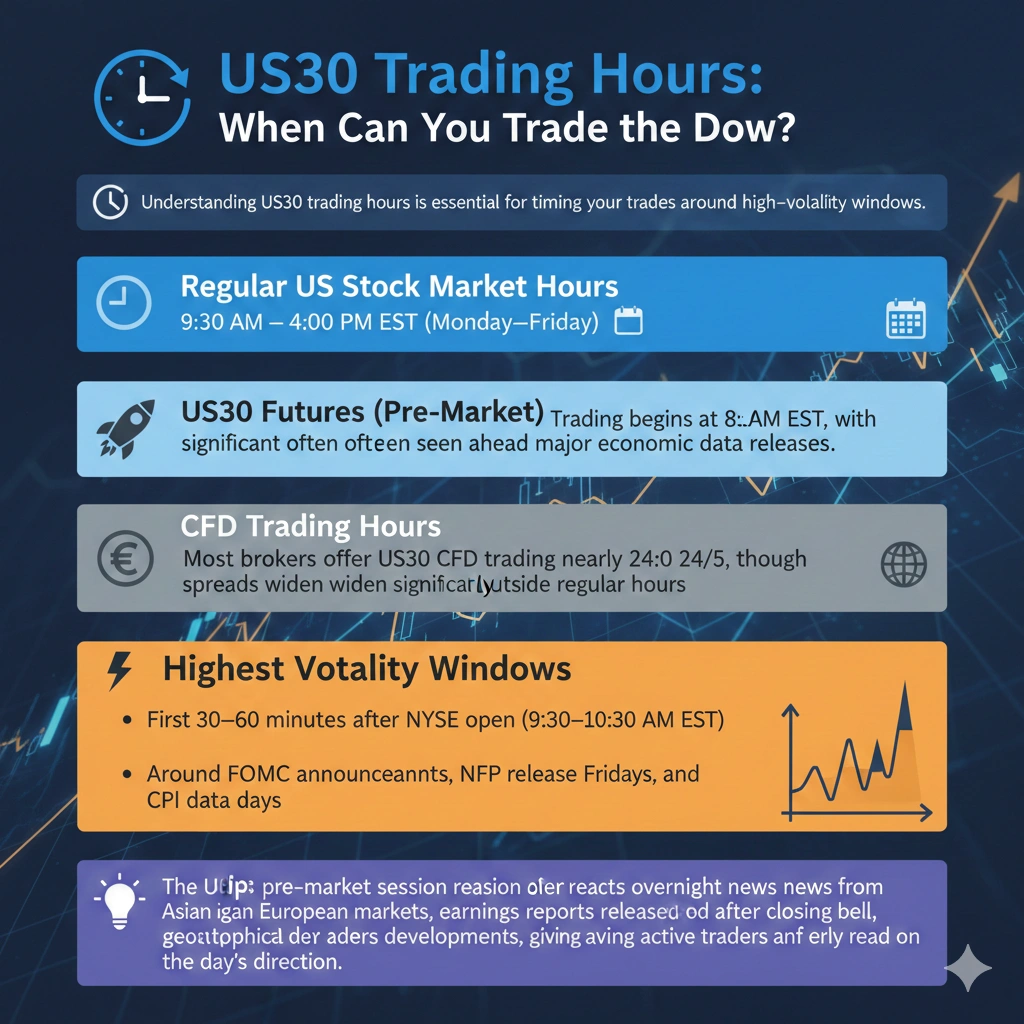
Understanding US30 trading hours is essential for timing your trades around high-volatility windows.
- Regular US Stock Market Hours: 9:30 AM – 4:00 PM EST (Monday–Friday)
- US30 Futures (Pre-Market): Trading begins at 8:00 AM EST, with significant movement often seen ahead of major economic data releases
- CFD Trading Hours: Most brokers offer US30 CFD trading nearly 24/5, though spreads widen significantly outside regular hours
- Highest Volatility Windows: First 30–60 minutes after NYSE open (9:30–10:30 AM EST) and around FOMC announcements, NFP release Fridays, and CPI data days
Pro Tip: The US30 pre-market session often reacts to overnight news from Asian and European markets, earnings reports released after closing bell, and geopolitical developments, giving active traders an early read on the day’s direction.
US30 vs S&P 500 vs Nasdaq 100: Key Differences
Traders often compare the US30 (Dow Jones) with the S&P 500 (US500) and the Nasdaq 100 (US100). Here’s how they differ:
| Index | Companies Tracked | Weighting Method | Sector Focus |
|---|---|---|---|
| US30 (DJIA) | 30 | Price-weighted | Diversified blue-chips |
| S&P 500 | 500 | Market-cap weighted | Broad US economy |
| Nasdaq 100 | 100 | Market-cap weighted | Tech-heavy |
The US30 tends to be more volatile on a points basis due to its price-weighted structure and smaller component count, making it a popular instrument for day traders and CFD traders seeking short-term opportunities. The S&P 500 is generally considered the broader benchmark for US economic health, while the Nasdaq reflects technology sector sentiment most closely.
External Market Forces That Influence US30
Beyond domestic data, global developments also play a major role in US30 market drivers.
a. Geopolitical Events & Global Tensions
Events like wars, diplomatic disputes, and global crises create uncertainty in the market, like:
- The tension in the Middle East is leading to higher oil prices, which drag on the Dow.
- Due to US–China trade disputes the volatility in industrial and tech stocks is high.
b. Commodity Prices – Especially Oil
Energy costs influence production, transportation, and overall inflation.
- High oil prices → inflation risks → pressure on US30
- Falling oil prices → cost relief → Dow support
Dow components in aviation, manufacturing, and logistics are sensitive to these shifts.
c. US Dollar Strength
The USD affects multinational earnings.
- Strong USD → reduced foreign income for US companies → bearish US30
- Weak USD → higher overseas revenue → bullish US30
This is particularly important for export-heavy companies.
Sector Movements Within the Dow Jones
While the Dow is an index of 30 companies, sector rotation plays a pivotal role.
- Cyclicals (industrials, financials, and tech) rise during growth periods.
- Defensives (healthcare, consumer staples) rise during downturns.
If you’re able to understand how sectors behave, it’ll help you interpret why the Dow moves even without major news releases.
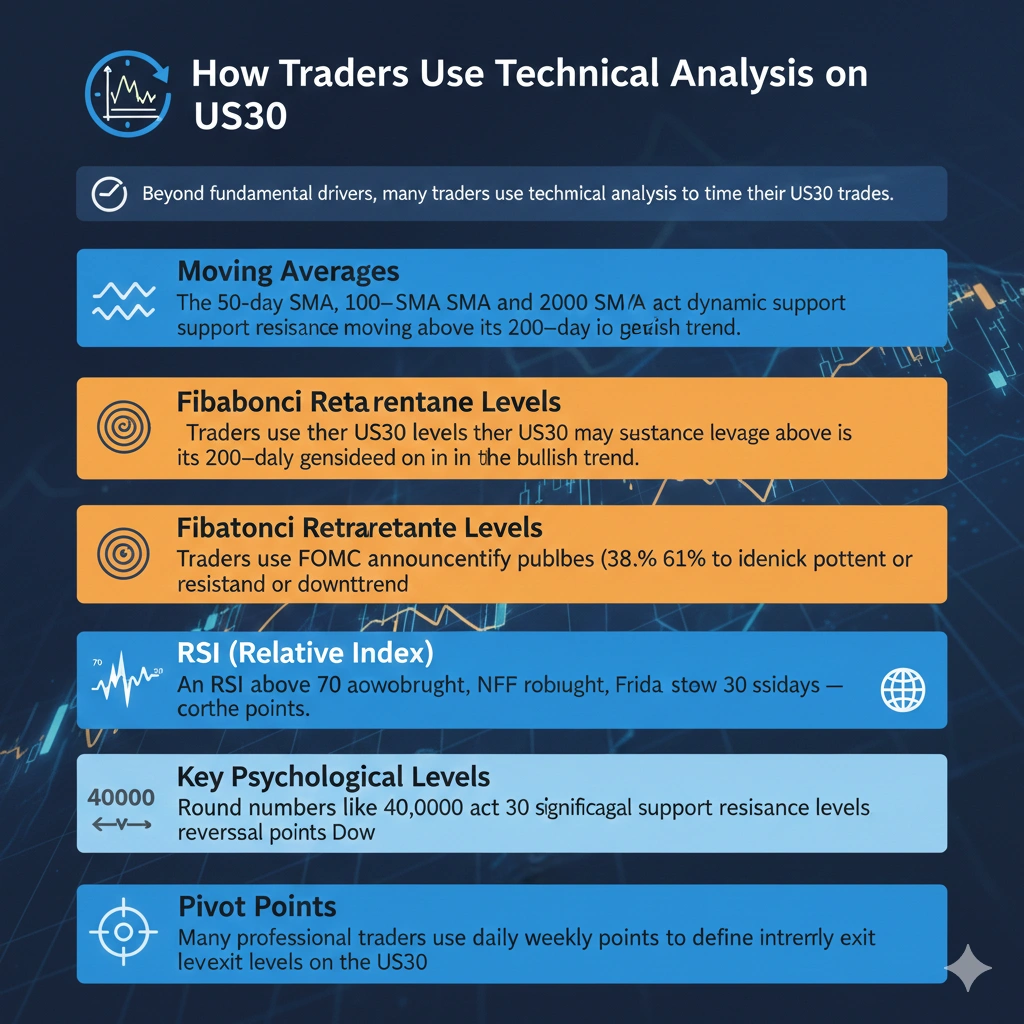
How Traders Use Technical Analysis on US30
Beyond fundamental drivers, many traders use technical analysis to time their US30 trades. Key tools include:
Moving Averages: The 50-day SMA, 100-day SMA, and 200-day SMA act as dynamic support and resistance levels. A US30 price trading above its 200-day moving average is generally considered to be in a bullish trend.
Fibonacci Retracement Levels: Traders use Fibonacci levels (38.2%, 50%, 61.8%) to identify potential pullback zones during an uptrend or resistance zones during a downtrend.
RSI (Relative Strength Index): An RSI above 70 signals the US30 may be overbought, while an RSI below 30 suggests it may be oversold — both potential reversal points.
Key Psychological Levels: Round numbers like 40,000, 45,000, and 50,000 act as significant psychological support and resistance levels for the Dow.
Pivot Points: Many professional traders use daily and weekly pivot points to define intraday entry and exit levels on the US30.
Why Tracking US30 Market Drivers Helps Traders
Monitoring these economic indicators allows traders to:
- Anticipate volatility
- Identify trend reversals early
- Understand how macro events shape market movement
- Position trades ahead of big data releases
- Make informed decisions instead of emotional ones
The Dow is a sentiment-driven index. Price action reflects expectations, fears, opportunities, and economic outlooks.
Real-World Example: How One Data Point Moves the Dow
This is a textbook example of how a single economic data point can trigger a multi-directional US30 move within the same trading session — first driven by economic optimism, then reversed by Fed policy fears. It highlights why understanding the relationship between labor market data and monetary policy expectations is essential for any serious US30 trader.
This is the classiest example of the Dow Jones movement explained by economists.
Risk Management When Trading US30
Given the high volatility of the US30 index, effective risk management is non-negotiable for both day traders and swing traders.
- Always use a stop-loss order to cap downside on every trade
- Avoid holding large US30 positions through FOMC announcements or NFP releases without a clear plan, as spreads can widen dramatically
- Use proper position sizing — risking no more than 1–2% of trading capital per trade is a widely recommended rule
- Be aware of overnight gap risk if holding US30 CFD positions across sessions
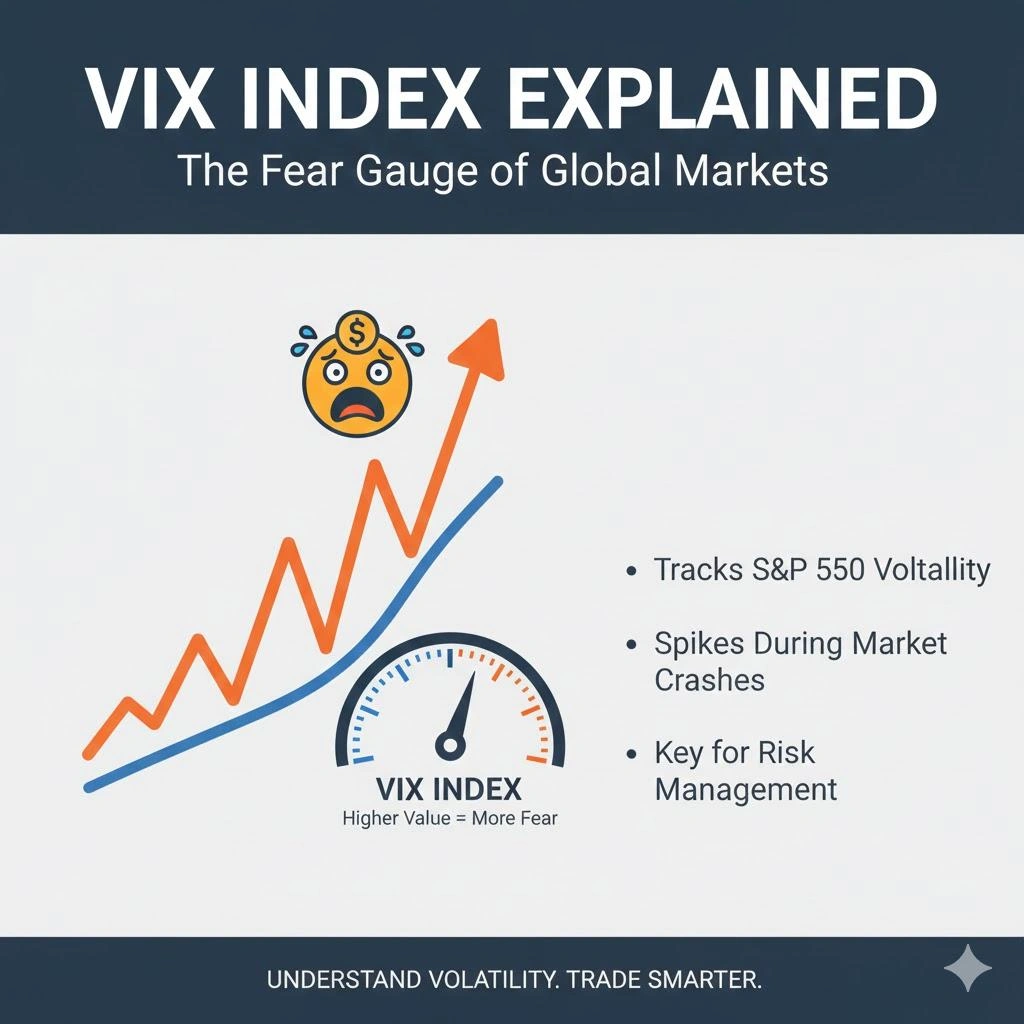
- Monitor the VIX (Volatility Index) — a rising VIX often precedes increased Dow Jones volatility
Conclusion: On US30 Market Drivers
The US30 index reacts very quickly to the economic, corporate, and global factors. It is very common for inflation, jobs data, and geopolitical tensions to influence the investors’ sentiment and market direction. Knowing these US30 market drivers will give you a major advantage in adapting to fast-changing market environments. In 2026, with Federal Reserve policy uncertainty, geopolitical tensions, and volatile earnings seasons continuing to shape market direction, staying informed on these US30 market drivers is more important than ever. Whether you are a day trader reacting to NFP releases or a swing trader positioning around FOMC decisions, understanding what moves the Dow Jones gives you a measurable edge.
To stay informed and trade smarter, visit Insightful Trade. Here you’ll get to learn more about how a market gets influenced and how as a trader you can seek opportunities in it. Their expert commentary and analytics help you interpret economic indicators more effectively and make better decisions in US30 and other major indices.
FAQs about US30 Market Drivers
Q1: What are the biggest factors affecting US30?
The US30 (Dow Jones Industrial Average) is most strongly influenced by Federal Reserve interest rate decisions, CPI and PCE inflation data, Non-Farm Payrolls (NFP) reports, quarterly GDP growth, corporate earnings results from its 30 component companies, and geopolitical events such as US-China trade tensions or Middle East conflicts. Additionally, US Dollar strength (DXY), oil prices, and consumer confidence data play a significant role in shaping US30 price direction in 2026.
Q2: How does the Federal Reserve impact the Dow Jones?
The Federal Reserve impacts the Dow Jones Industrial Average primarily through interest rate decisions made at FOMC meetings. When the Fed raises interest rates, borrowing costs increase for businesses, corporate profits shrink, and investors rotate away from equities — putting downward pressure on the US30. Conversely, when the Fed cuts interest rates or signals a dovish monetary policy stance, liquidity increases in the market, encouraging investment in stocks and typically driving the US30 higher. In 2026, traders are closely monitoring every Fed Chair Jerome Powell statement for clues on the rate cut timeline.
Q3: Does NFP always cause volatility in US30?
Yes — the Non-Farm Payrolls (NFP) report, released on the first Friday of every month by the US Bureau of Labor Statistics, is one of the most consistent triggers of US30 volatility. A stronger-than-expected NFP can initially push the Dow Jones higher on economic optimism, but may later reverse if markets fear the strong data will delay Federal Reserve rate cuts. A weaker-than-expected NFP typically causes an immediate US30 sell-off on recession fears. While the volatility is often short-term and intraday, the magnitude can be significant — making NFP Fridays among the most critical sessions for US30 day traders.
Q4: Why does the US30 react to oil prices?
The US30 reacts to oil prices because energy costs directly affect the operating expenses and profit margins of several Dow Jones component companies, particularly those in aviation, logistics, manufacturing, and transport — such as Boeing, Caterpillar, and 3M. Rising oil prices increase production and transportation costs, contribute to broader inflation, and can prompt the Federal Reserve to maintain higher interest rates — all of which are bearish for the US30. Conversely, falling oil prices reduce costs across industries, ease inflationary pressure, and generally provide bullish support for the Dow Jones.
Q5: Is US30 good for day trading?
Yes, the US30 is one of the most popular instruments for day trading due to its high liquidity, consistent volatility, and sensitivity to scheduled economic events like NFP releases, CPI data, and FOMC announcements — all of which create clear intraday trading opportunities. The index’s price-weighted structure means single high-priced components can cause sharp moves, which active traders can capitalize on. However, successful US30 day trading requires strict risk management, including defined stop-loss levels, proper position sizing, and avoiding overexposure during high-impact news events when spreads widen significantly.
Author: Kumkum Chandak
Experience: 3+ Years in Trading Research & Market Content Strategy
Kumkum Chandak is a trading content strategist and market research writer who specializes in simplifying technical analysis, trading tools, and strategy-driven educational content. Her work is optimized for EEAT, accuracy, and user intent, ensuring every article delivers practical insights for traders of all levels.
Risk Disclaimer:
Trading involves substantial risk. All information is for educational purposes only and should not be taken as financial advice. Always do your own research.
Last Updated: 24 February 2026