Understanding the VIX has become almost essential for anyone active in the markets today. Every trader, whether they are a beginner or someone who has years of experience, should know that the VIX helps you understand the market conditions better, which price charts can’t do alone.
In this guide, we’ll explore the VIX index explained in a more simple and practical way. In it we’ll learn what it is, why it’s important, how pros use it to gauge fear, and how you can use it to improve your trading decisions.
1. What Is the VIX? A Simple and Clear Breakdown
To begin with, let’s make the VIX Index Explained concept easy to grasp.
The VIX, developed by the Chicago Board Options Exchange (CBOE), is essentially a market volatility indicator that measures the expected volatility for the next 30 days based on S&P 500 options pricing.
Here’s the easiest way to understand it:
- When the VIX is high, there is fear and uncertainty in the market.
- When the VIX is low, the market is stable and reliable.
- When the VIX suddenly rises, it means panic, sudden news, or institutional hedging.
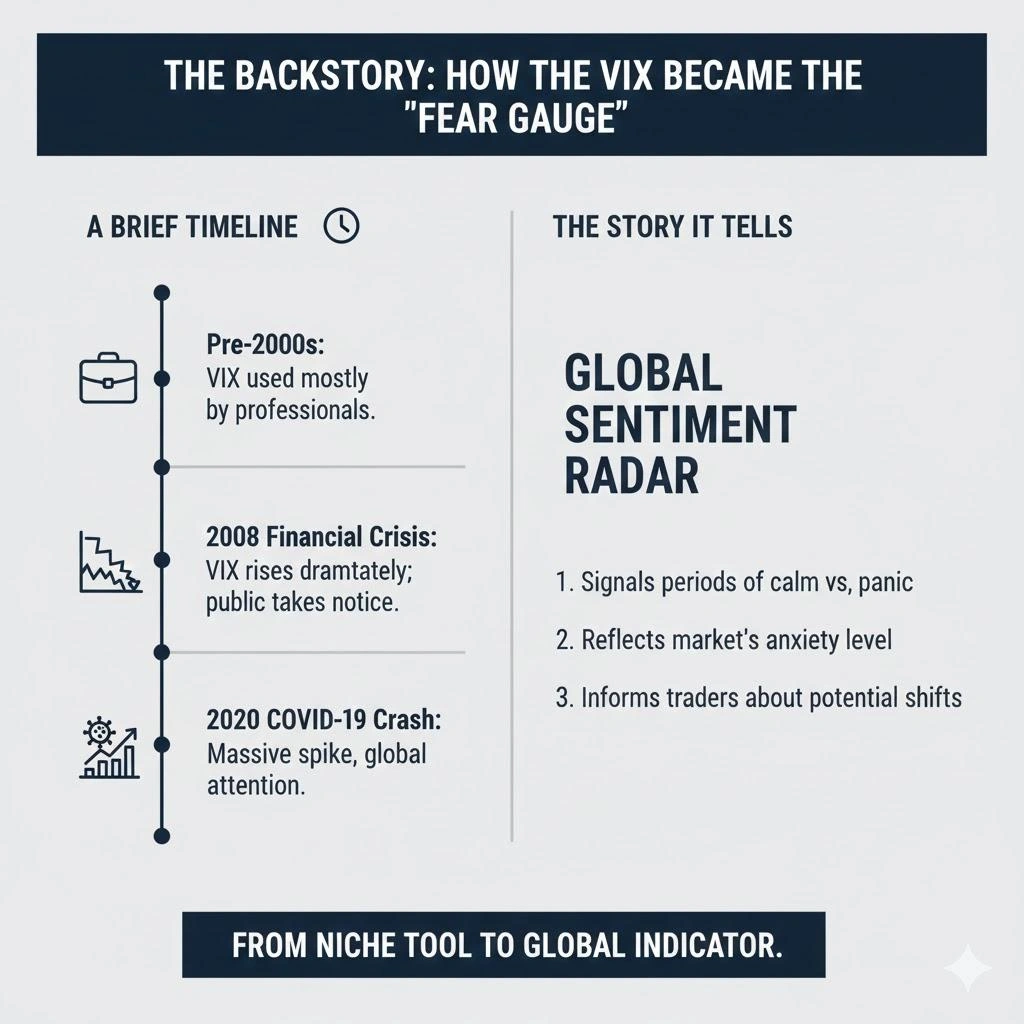
2. The Backstory: How the VIX Became the “Fear Gauge”
The VIX wasn’t always a popular term among retail traders. It became widely known after the 2008 financial crisis, when fear in the markets skyrocketed and the VIX shot above 80, a historically high level. Since then, the VIX has become the most recognized fear index analysis tool in the world.
A quick timeline helps explain why:
- Pre-2000s: VIX was used mostly by professionals.
- 2008 Crisis: VIX rises dramatically; the public starts hearing about it.
- Covid-19 2020 Crash: Another massive spike brings global attention again.
- Today: Almost every trader uses the VIX as a volatility signal.
This history is what gives the VIX significance beyond just a number; it tells a story about global sentiment.
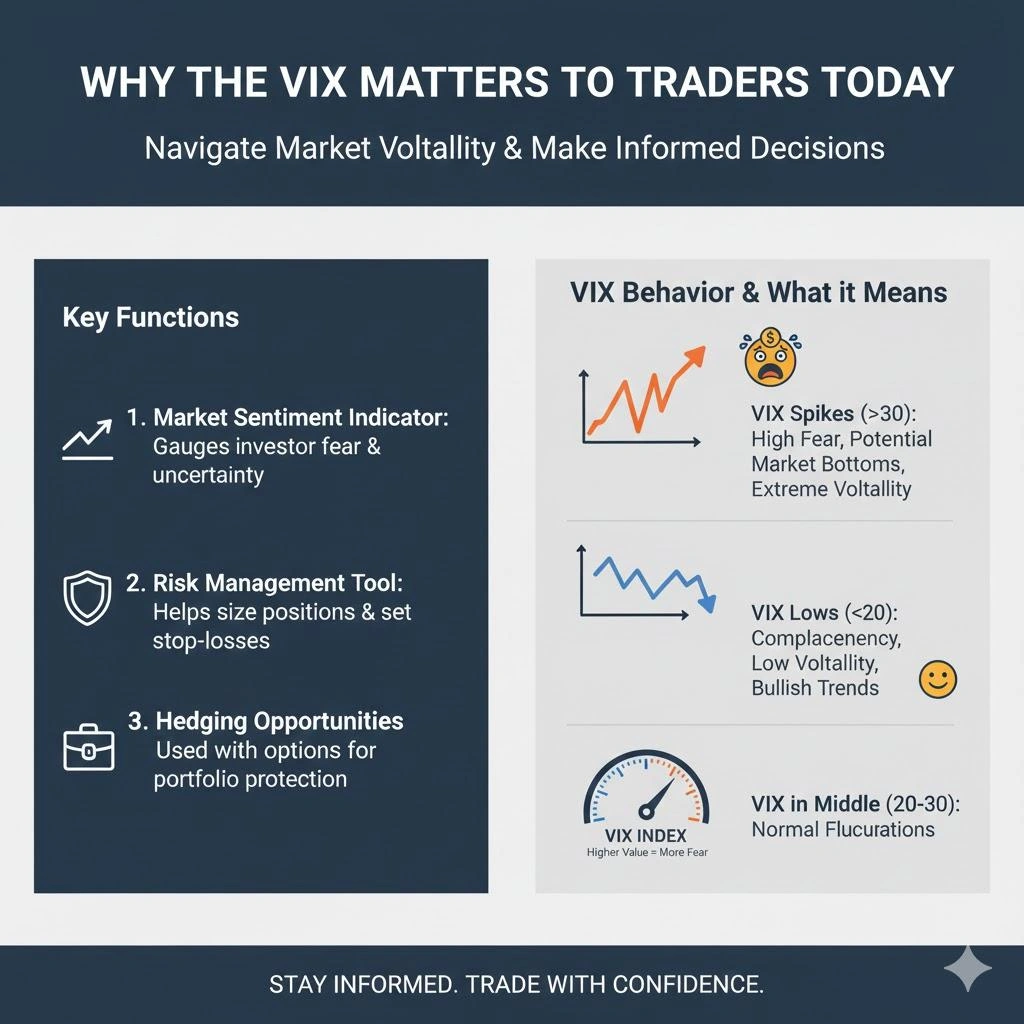
3. Why the VIX Matters to Traders Today
To continue with the VIX Index Explained framework, let’s look at why traders genuinely care about this index.
Traders look at the VIX to:
- To predict whether the market is calm or chaotic
- To assess the availability of market volatility
- To prepare for major trend moves or reversals
- To manage risk more effectively
- To time entry and exit during news-packed weeks
Above all, the VIX gives traders a “sentiment map” before making decisions.
4. Understanding How the VIX Moves (Explained Simply)
The VIX moves for three main reasons:
1. Sudden news events
Political statements, global conflicts, economic data, or unexpected announcements often cause VIX surges.
2. Sharp price moves in the S&P 500
When the S&P 500 drops rapidly, the VIX almost always jumps.
3. Options premiums rising
Institutions pay higher premiums for protective options when they sense risk.
Higher demand = higher VIX.
This is why it is called a market volatility indicator, it reacts faster than price does.
5. A Story-Based Example: How the VIX Saved a Trader from a Bad Day
To make the VIX Index Explained journey relatable, here’s a real-style example:
Meet Sam, a trader trading US30. He wakes up on a Wednesday morning and analyzes the market. At first glance everything looks perfect: stable candles and volume. But when he was about to place the trade, he saw the VIX had already climbed from 15 to 20 overnight.
Sam paused
He checked the news and saw upcoming inflation data and some geopolitical headlines. That’s why he decided to wait for his next trade, to avoid unnecessary risk
And when the U.S. market opened, it was chaotic. There were fake breakouts and then sudden reversals, wiping out the traders’ capital.
Many traders were caught in this volatility.
Sam wasn’t.
Why? Because he knew that a rising VIX means that the environment in the market is dangerous and it’s better to stay out of it for now. The fear index analysis also helped him a lot.
6. VIX Levels and What They Usually Mean
To make things practical, here’s how traders interpret VIX values:
• Below 12, Extremely low volatility
Markets are stable, trending cleanly, and predictable in their moves.
• 12 to 20, Normal range
Healthy market structure, moderate volatility.
• 20 to 30, Fear rising
Expect bigger candles, sudden spikes, and fakeouts.
• Above 30, High volatility
News-driven movements, instability, high risk.
• Above 40, Panic zone
Only experienced traders handle these markets; beginners should avoid trading.
These benchmarks help traders understand conditions instantly.
7. How the VIX Is Used in Trading: A Practical Guide
- Risk adjustment
High VIX means a highly volatile market. In such a situation you should reduce position size to avoid risk.
- Timing entries
Low VIX = calm trends
High VIX = sharp reversals
- News event preparation
If the VIX is rising up before any major news announcements, take it as a warning. Don’t make any wrong moves.
- Predicting liquidity grabs
Large institutions often set high filters to trap impatient traders; wait for confirmation before entering.
- Hedging
When the risk is high, pro traders hedge their positions, while amateurs double their positions.
Understanding this completes the VIX Index Explained picture.
8. VIX and Global Markets: Why Every Trader Should Watch It
Although the VIX is based on the S&P 500, it influences everything:
- US30, NAS100
- Gold
- Crude Oil
- EURUSD and GBPUSD
- Nifty, BankNifty
- Bitcoin
Whenever the VIX rises, volatility spreads globally.
This is why every serious trader keeps a tab on it.
9. Mistakes Traders Make While Using the VIX
There are many mistakes beginners make in starting to learn about the VIX. But here’s how you can avoid those mistakes:
- The high VIX creates fear, but there is no guarantee of a market crash.
- By VIX you can calculate the speed of the market, but not in which direction.
- Never Ignore the price action; the VIX tells you market sentiments but the price chart is still your map
- High VIX can be a great opportunity, but for beginners it’s a fast way to lose money
- Adjust your stop-loss sizes during volatile sessions
Avoiding these mistakes makes you safer and more prepared.
10. What Beginners Should Learn from the VIX
If you’re new to the VIX, here’s what you need to know about it:
- It’s used to spread awareness, not to trigger a buy or sell
- It helps you identify the market conditions before you start your trading day
- It teaches discipline; it will tell you to wait for better setups
- By using VIX, you can protect your capital on highly volatile days
Mastering the VIX gives you a deeper understanding of market behavior.
Conclusion
In this blog, we broke the concept of the VIX Index Explained into simple, practical pieces so anyone, beginner or expert, can understand how this powerful volatility gauge works. The VIX is more than just a statistic; it’s a real-time radar that helps you discover the market conditions. So that you can manage your risk, avoid unnecessary losses, and spot opportunities that others miss during the market panic.
At Insightful Trade we believe in trading with clarity, not confusion. They provide expert guidance for better utilization of VIX in all financial instruments, whether you focus on indices, forex, or commodities. As it’s very helpful in decision-making and keeps you one step ahead of the crowd.
FAQs
- What does the VIX actually measure?
It measures expected market volatility for the next 30 days based on S&P 500 options pricing.
- Does a high VIX mean the market will crash?
Not necessarily. It signals fear but not direction, only heightened volatility.
- Can beginners use the VIX?
Yes, it’s a helpful market volatility indicator to understand conditions before trading.
- Why does the VIX rise during news events?
Institutions hedge their positions, increasing demand for options, which pushes the VIX up.
- How often should traders check the VIX?
Daily. A quick glance helps assess volatility levels and plan safer trades.
Author: Kumkum Chandak
Experience: 3+ Years in Trading Research & Market Content Strategy
Kumkum Chandak is a trading content strategist and market research writer who specializes in simplifying technical analysis, trading tools, and strategy-driven educational content. Her work is optimized for EEAT, accuracy, and user intent, ensuring every article delivers practical insights for traders of all levels.
Risk Disclaimer:
All content is strictly educational and not financial advice. Trading involves substantial risk. Always perform your own analysis or consult a professional advisor.
Last Updated: 5 December 2025